This electronic supplement contains information on some of the methods used (images used to undertake geomorphological mapping; Fig. S1), images that show where liquefaction occurred in the wider study area (Fig. S2), trench logs (Figs. S3–S14), descriptions of units exposed in the trenches (Tables S1–S10), information on dike and sand-blow parameters (dimensions; Table S11 and Fig. S15), information on dike azimuths, including stereo plots (Table S12 and Figs. S16 and S17), core logs with unit descriptions (Figs. S18–S21), and information on radiocarbon samples and ages and OxCal analysis (Table S13 and Figs. S22–S24).
For Figure S1, we produced a detailed geomorphic map and updated the existing map of the occurrence of sand blows and other surface effects of liquefaction. We used the following resources: (1) aerial imagery of pre-2010 stereo pairs taken in the 1940s and 1960s with a 1:16,000 scale; (2) modern orthophotos from Land Information New Zealand (LINZ), Landcare Research, Google Earth; (3) maps of the distribution of sand blows produced by a consortium of institutions (GNS Science, Tonkin and Taylor, Lincoln University, Beca, University of Canterbury, and Geotech Consulting) immediately after the event (Brackley, 2012); (4) Canterbury Landform map from GNS Science 2013 (D. Barrell, personal comm., 2013); and (5) digital elevation model (DEM) from light detection and ranging (lidar) survey from Canterbury Geotechnical Database (CGD). We analyzed the DEM derived from the lidar and aerial photos taken after the events. Lidar surveys and aerial photography were acquired in 2003 prior to the Darfield earthquake and after each of the largest earthquakes in the Canterbury earthquake sequence (4 September 2010, 22 February 2011, 13 June 2011, and 23 December 2011). The Marchand and Hardwick sites were covered by a survey flown between 8 and 10 March 2011. The survey was conducted by New Zealand Aerial Mapping (NZAM) using an Optech Gemini (07SEN211) instrument flown from a light plane at a typical altitude of ~900 m above ground level. Sensor settings of 100 kHz of pulse repetition frequency, 48 Hz scan frequency, and 40° field-of-view were used. To support the georeferencing of the sensor, a Global Navigational Satellite Systems base station receiver was operated at a temporary survey mark that NZAM established at Christchurch Airport. Independent of this work, GNS Science staff field-surveyed lidar control sites. These were used to correct the lidar dataset to the postearthquake 22 February 2011 geodetic system (Palmer, 2011). Positioning and orientation data were combined with lidar range files and processed into lidar point clouds by NZAM. The resulting point cloud is within the manufacturer’s specifications of a vertical accuracy of ±0.1 m. The point cloud was classified into ground, first, and intermediate returns using automated routines and manually edited to increase quality. Bare-earth DEMs and hillshade models with a ground resolution of 1 m were generated from the ground returns using inverse distance weighting interpolation with a minimum of 12 points and a search radius of 20 m.
Figure S1. Examples of (a) digital elevation model (DEM) from light detection and ranging (lidar) data (blue, low elevation; red, high elevation), (b) orthophotos, and (c) old aerial photos (1940s) at the same site.
Figure S2. (a) Orthophoto and (b) DEM from lidar data of the study area, collected after the 2010–2011 liquefaction events. Locations of the two study sites are shown. Note that liquefaction sand blows can be observed on the orthophoto (see Figs. 3a and 9a of the main article for an enlarged version of these images at the study sites).
Figure S3. Trench log of HWK 1 (Hardwick) trench west wall with auger hole log. See Table S1 for trench unit description.
Figure S4. Trench log of HWK 3 trench west wall. See Table S3 for trench unit description.
Figure S5. Trench log of HWK 3 trench east wall. See Table S3 for trench unit description.
Figure S6. Trench log of HWK 4b trench west wall. Note: The east wall was not logged. See Table S5 for trench unit description.
Figure S7. Trench log of HWK 5 trench east wall. Hardwick 5E1 and E2a are the walls exposed after excavating behind wall 5E and exposing the same sand blow and dike 20 cm and 40 cm to the east of wall 5E. Hardwick 5E2b is a more detailed log of the sand blow in Hardwick 5E2a. See Table S6 for trench unit description.
Figure S8. Trench log of HWK 5 trench west wall with log of hand piston core HWK 5-1. See Table S6 for trench unit description.
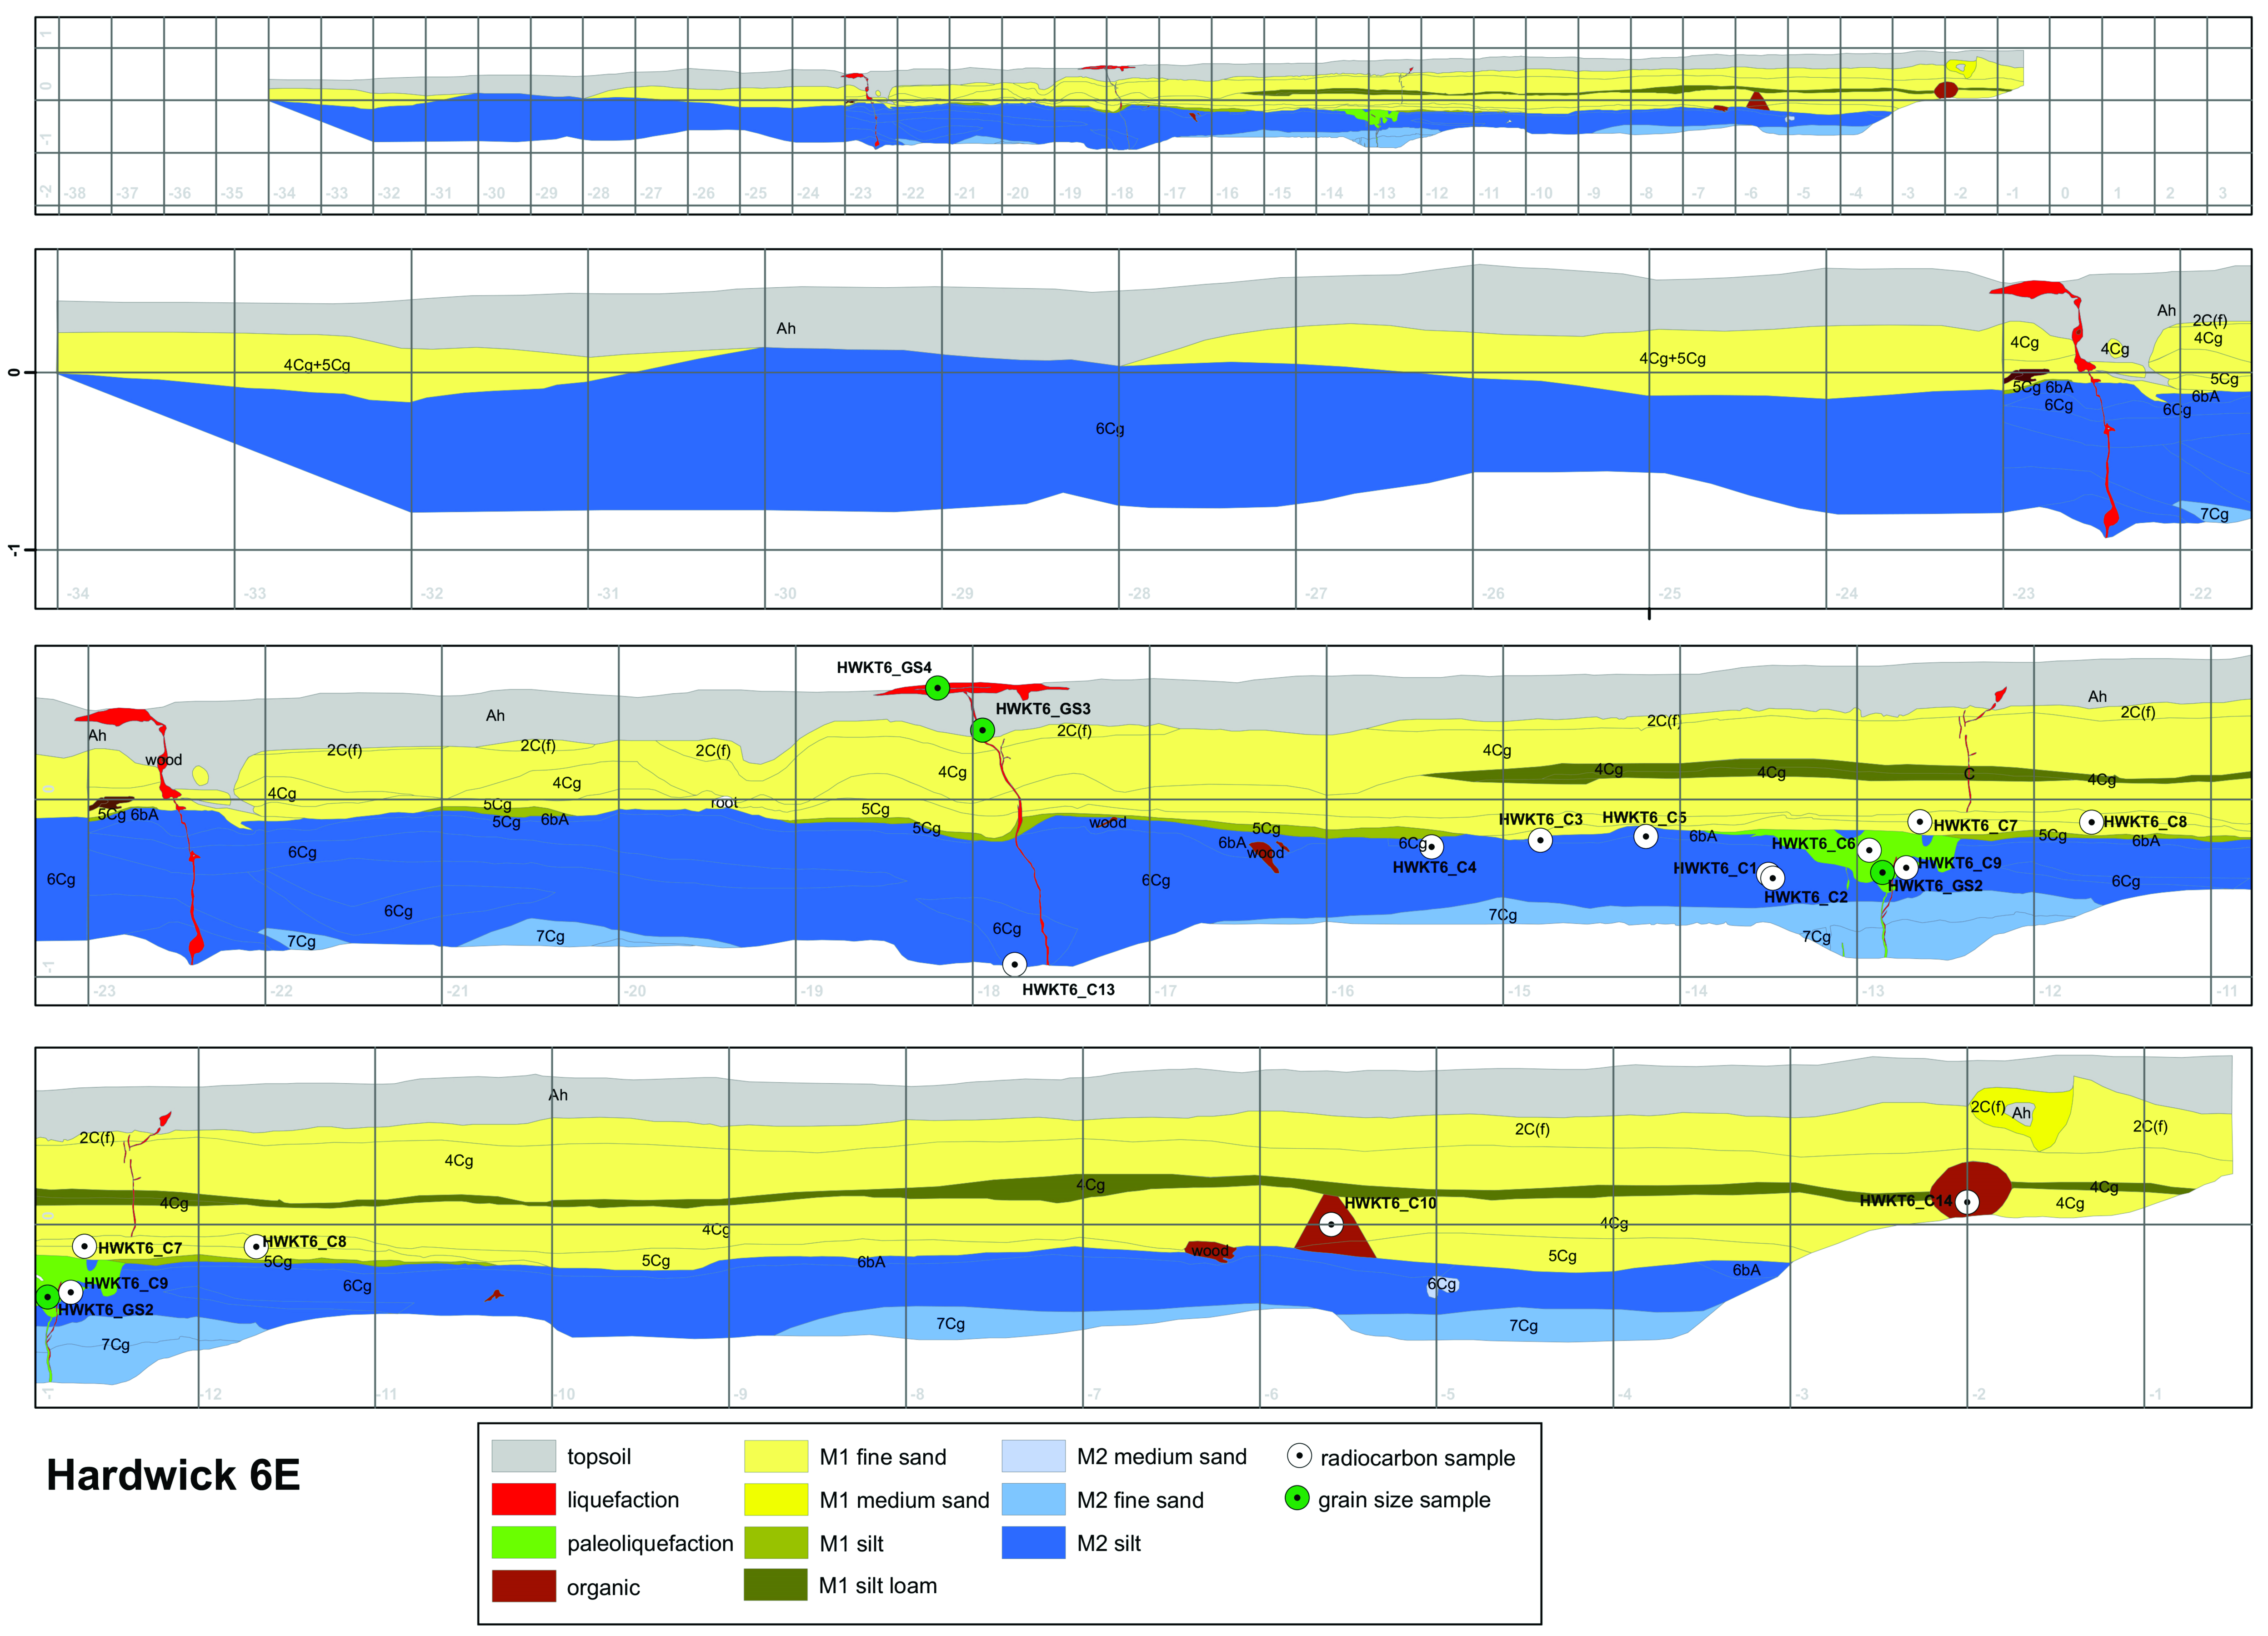
Figure S9. Trench log of HWK 6 trench east wall. The top figure displays the whole trench log. Other figures display the log in sections. See Table S7 for trench unit description.
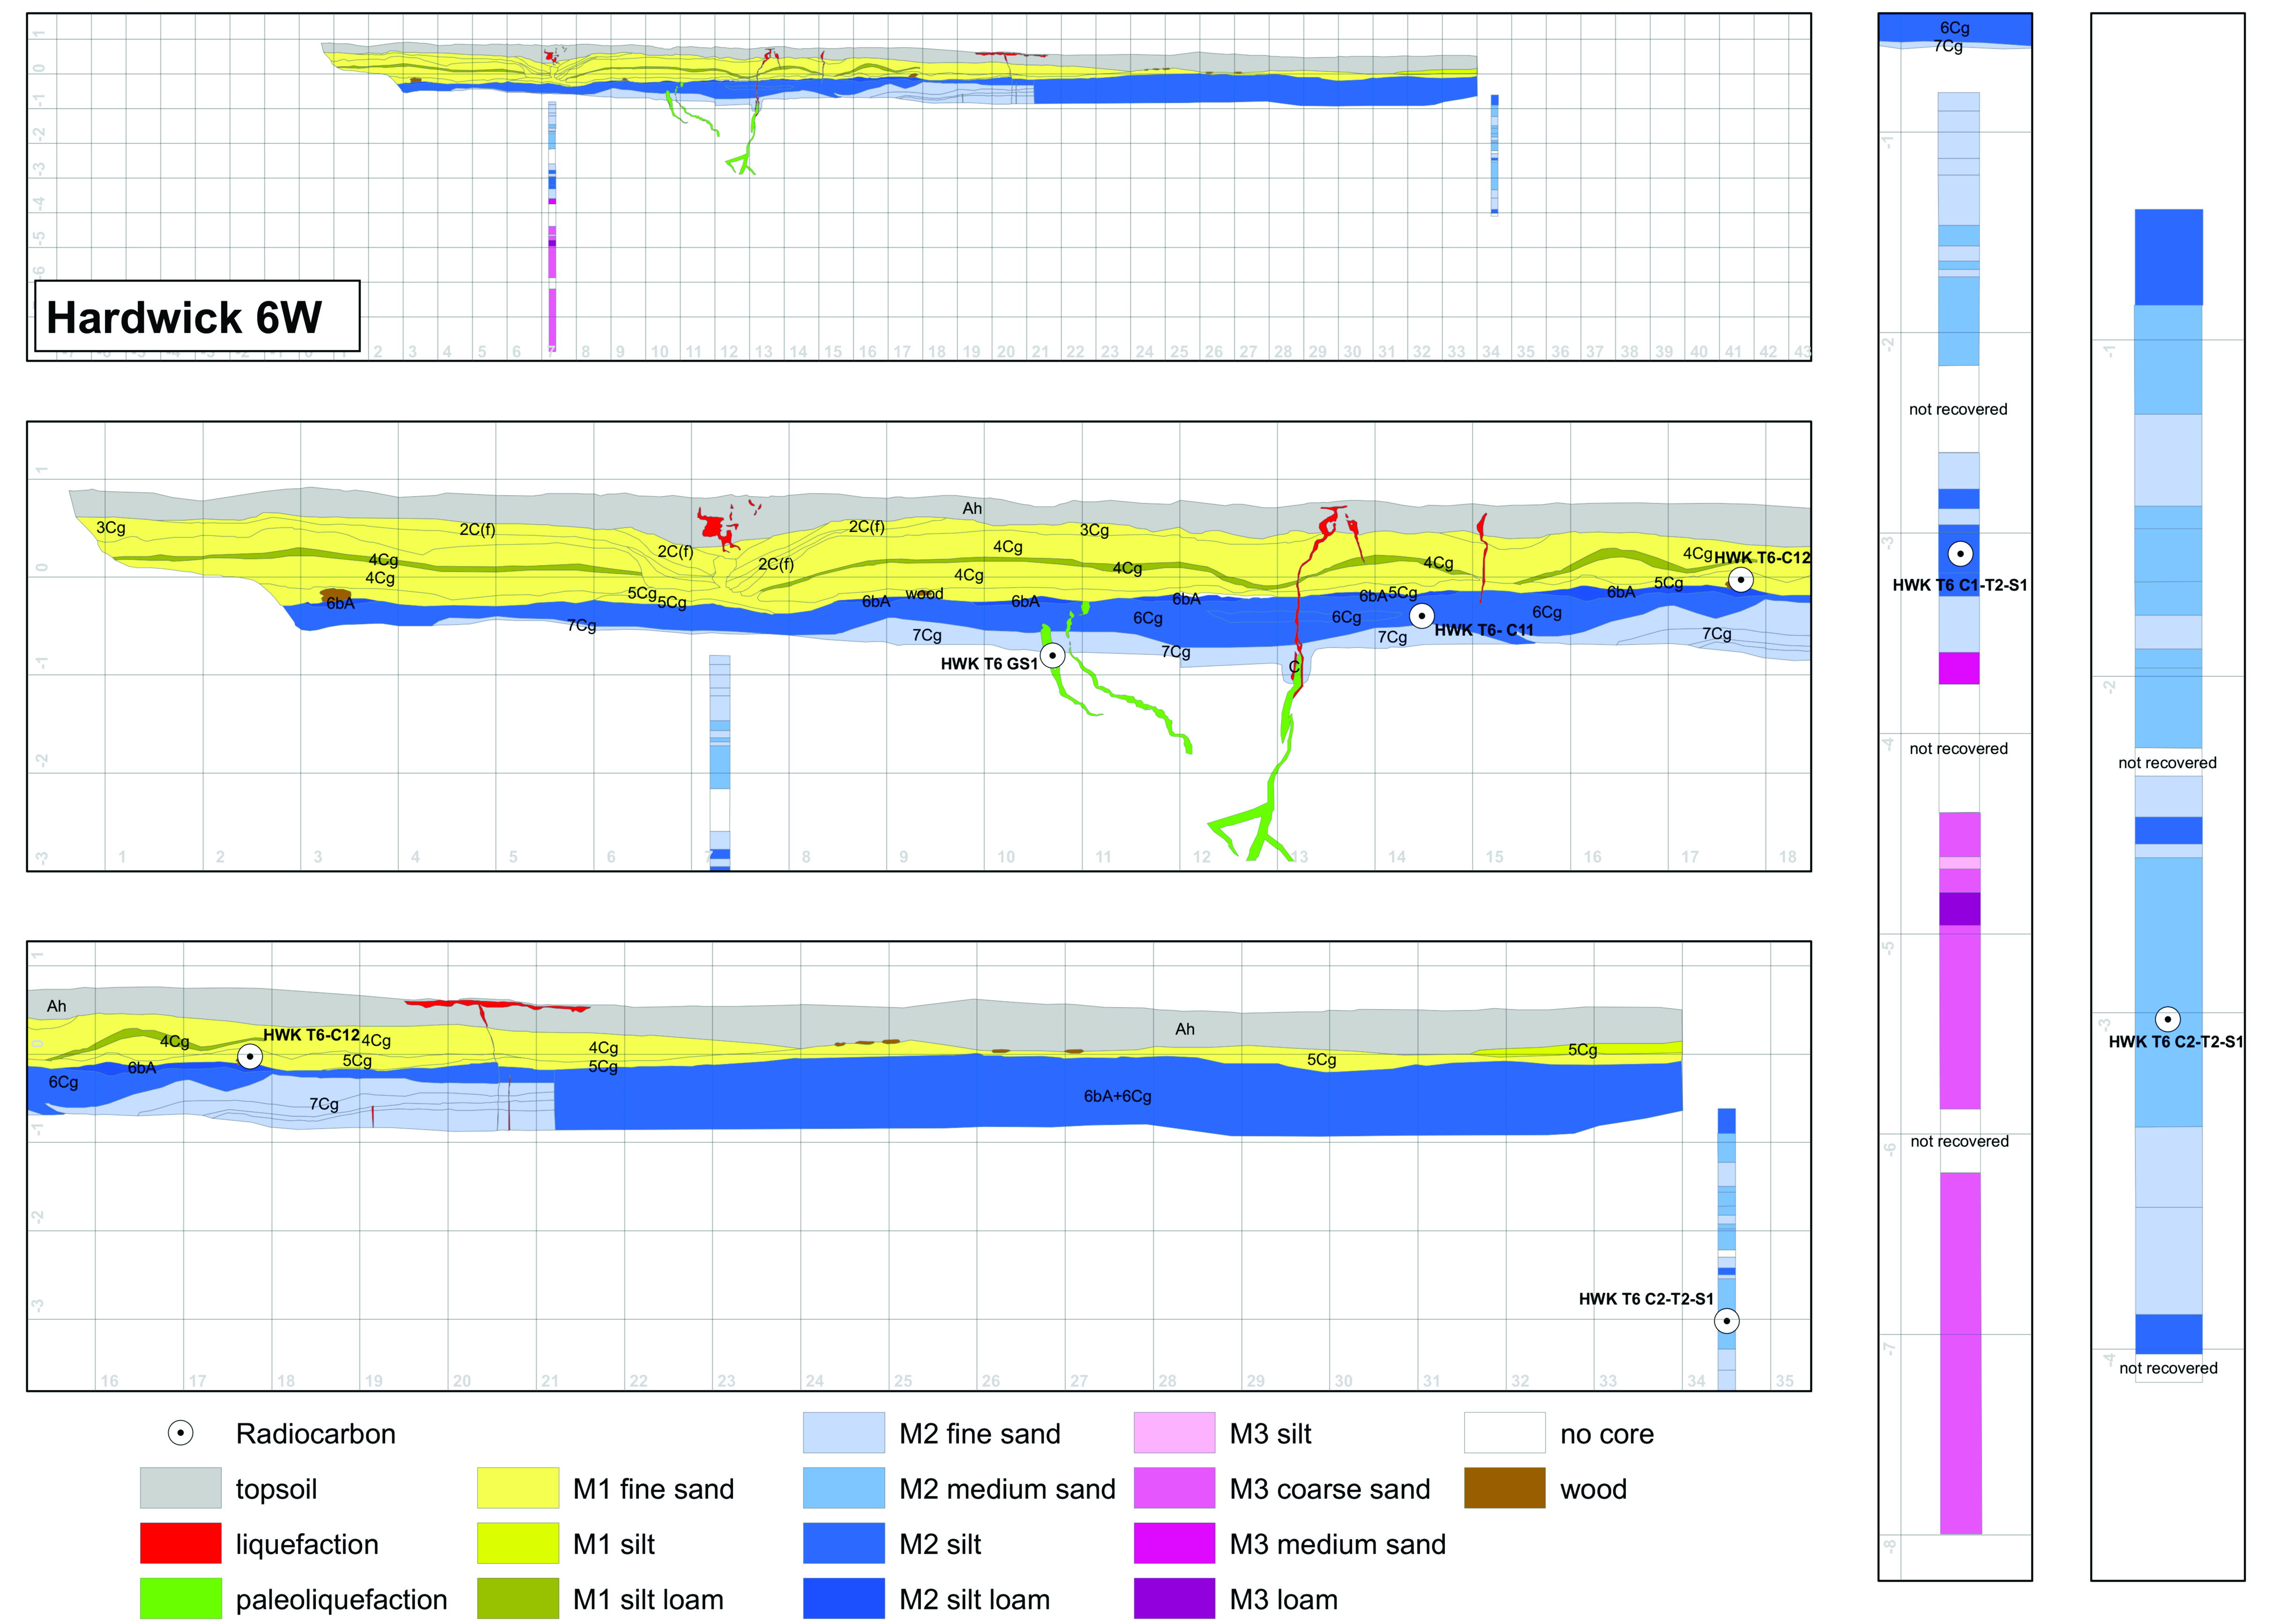
Figure S10. Trench log of HWK 6 trench west wall with log of hand piston cores HWK 6-1 (right) and HWK 6-2 (left). See Table S7 for trench unit description.
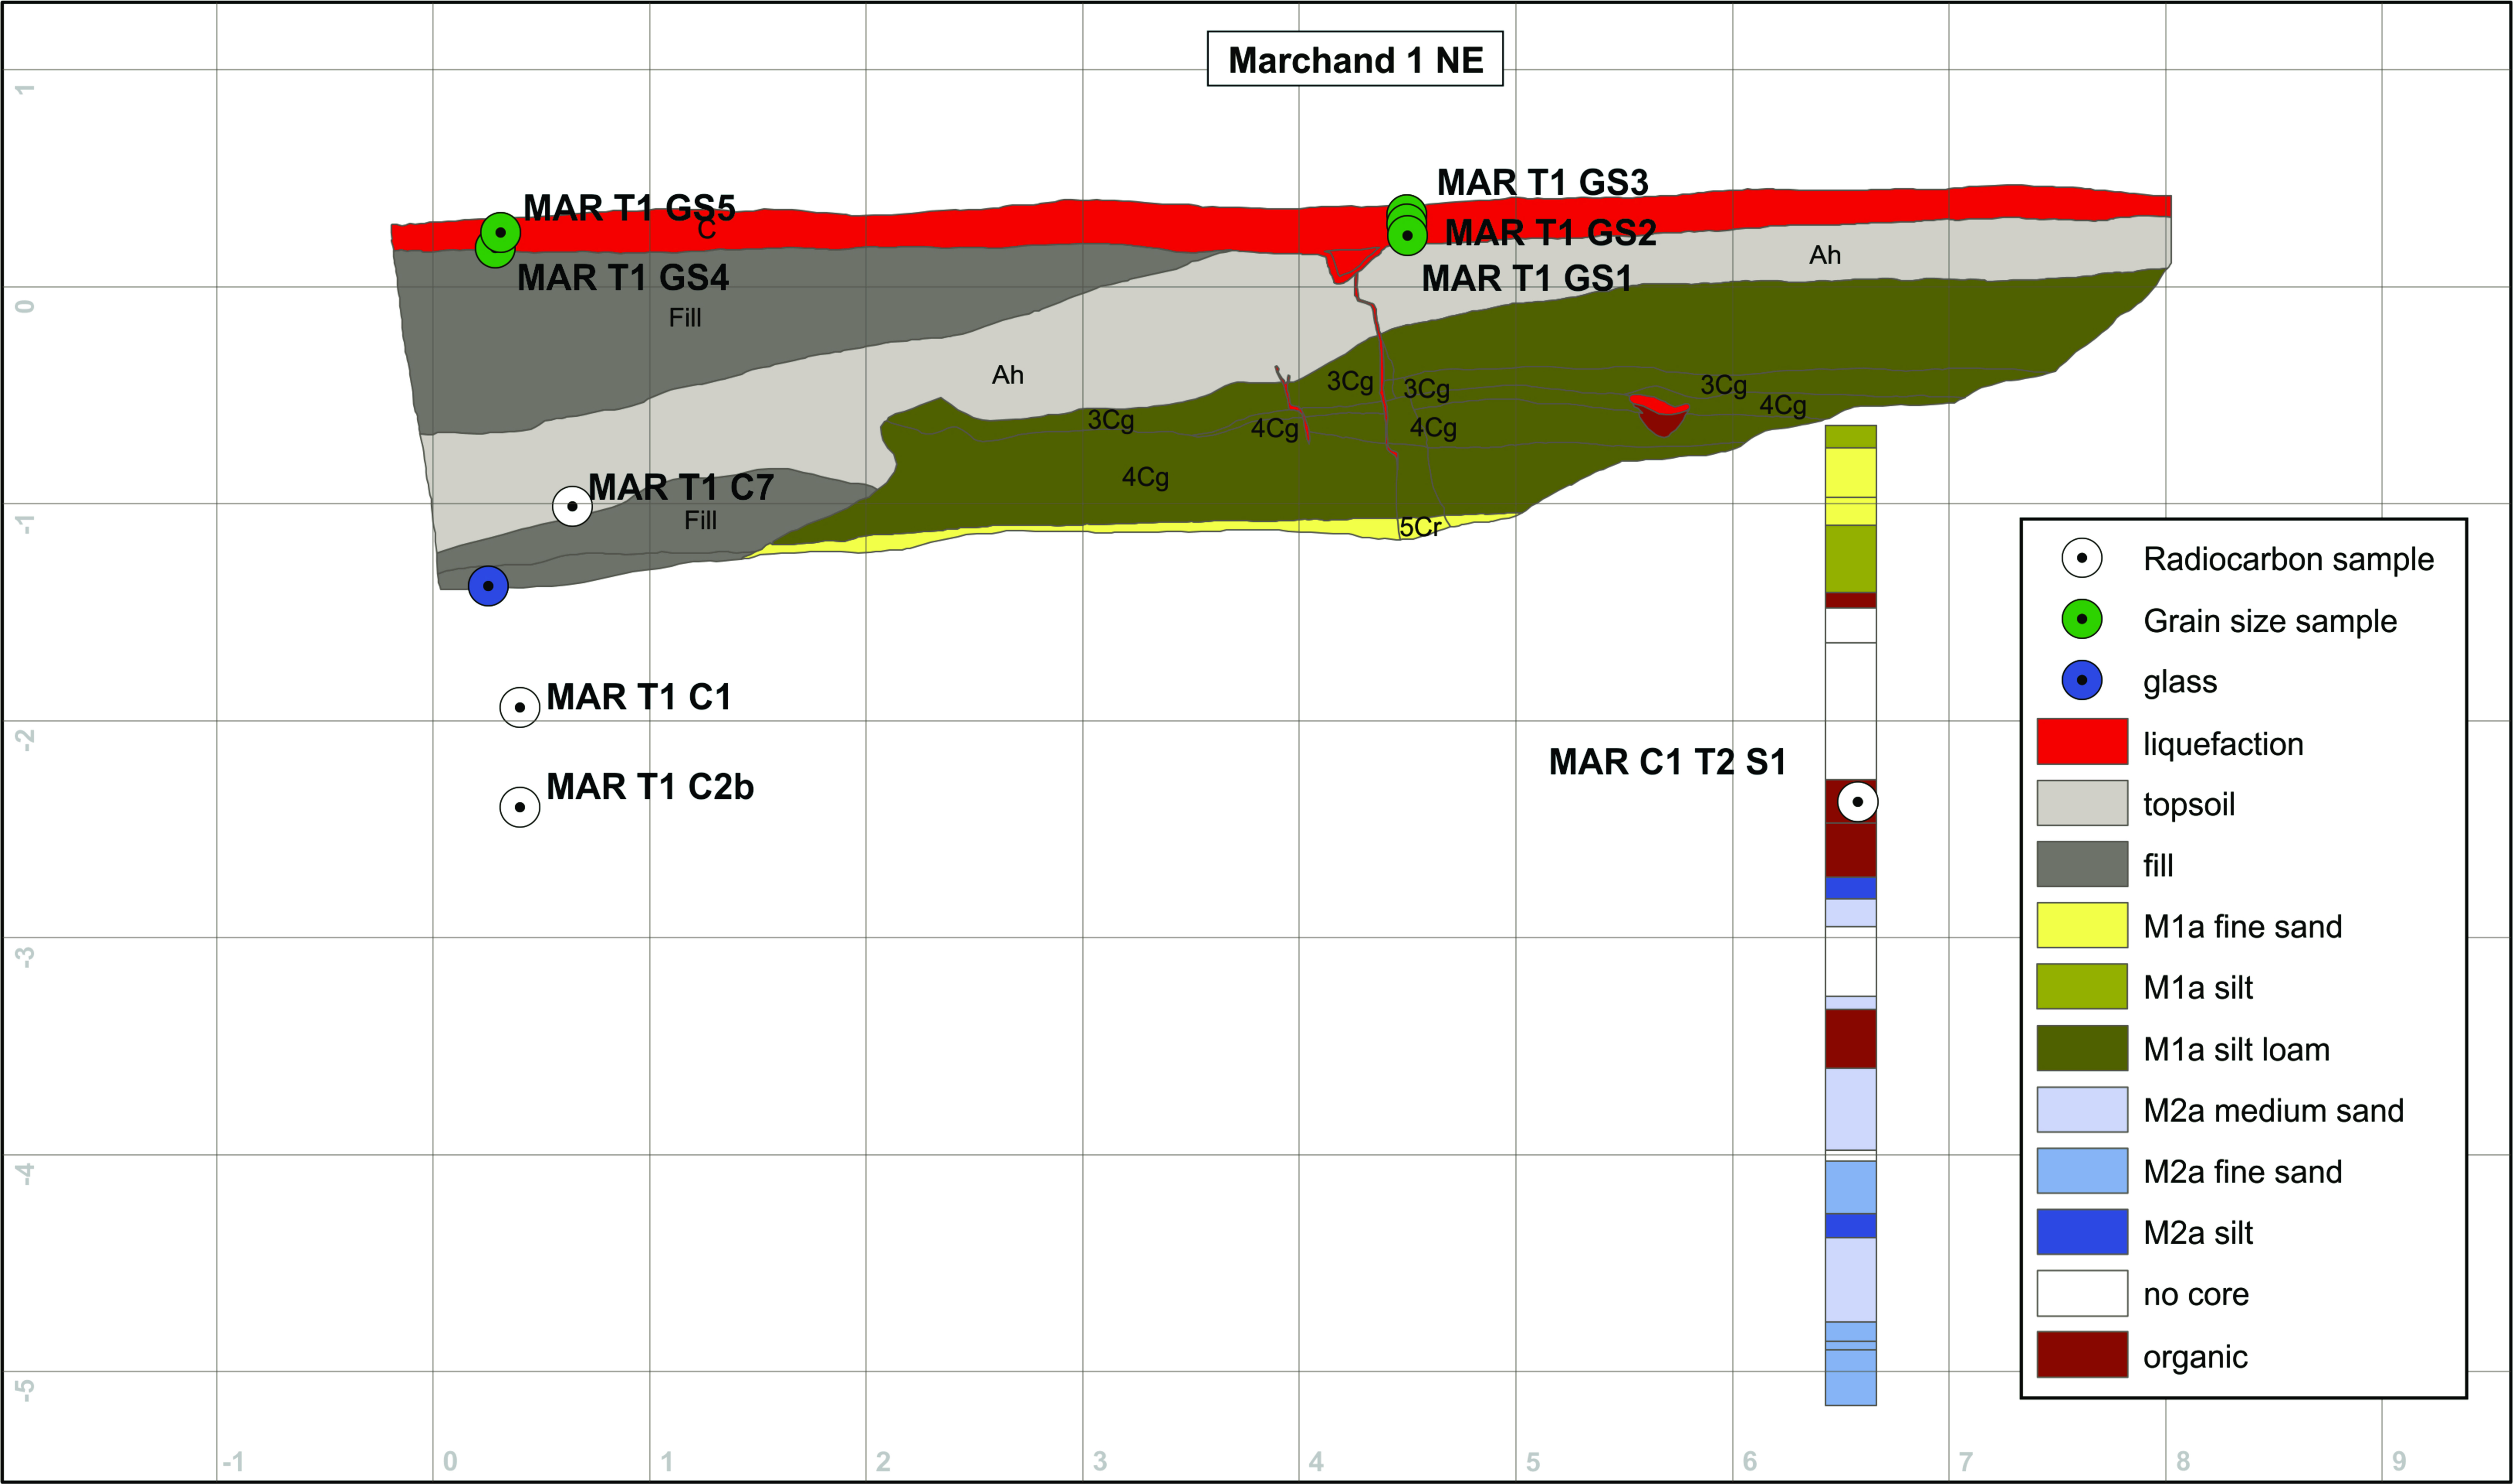
Figure S11. Trench log of MAR 1 trench northeast wall with log of hand piston core MAR 1-1. See Table S8 for trench unit description.
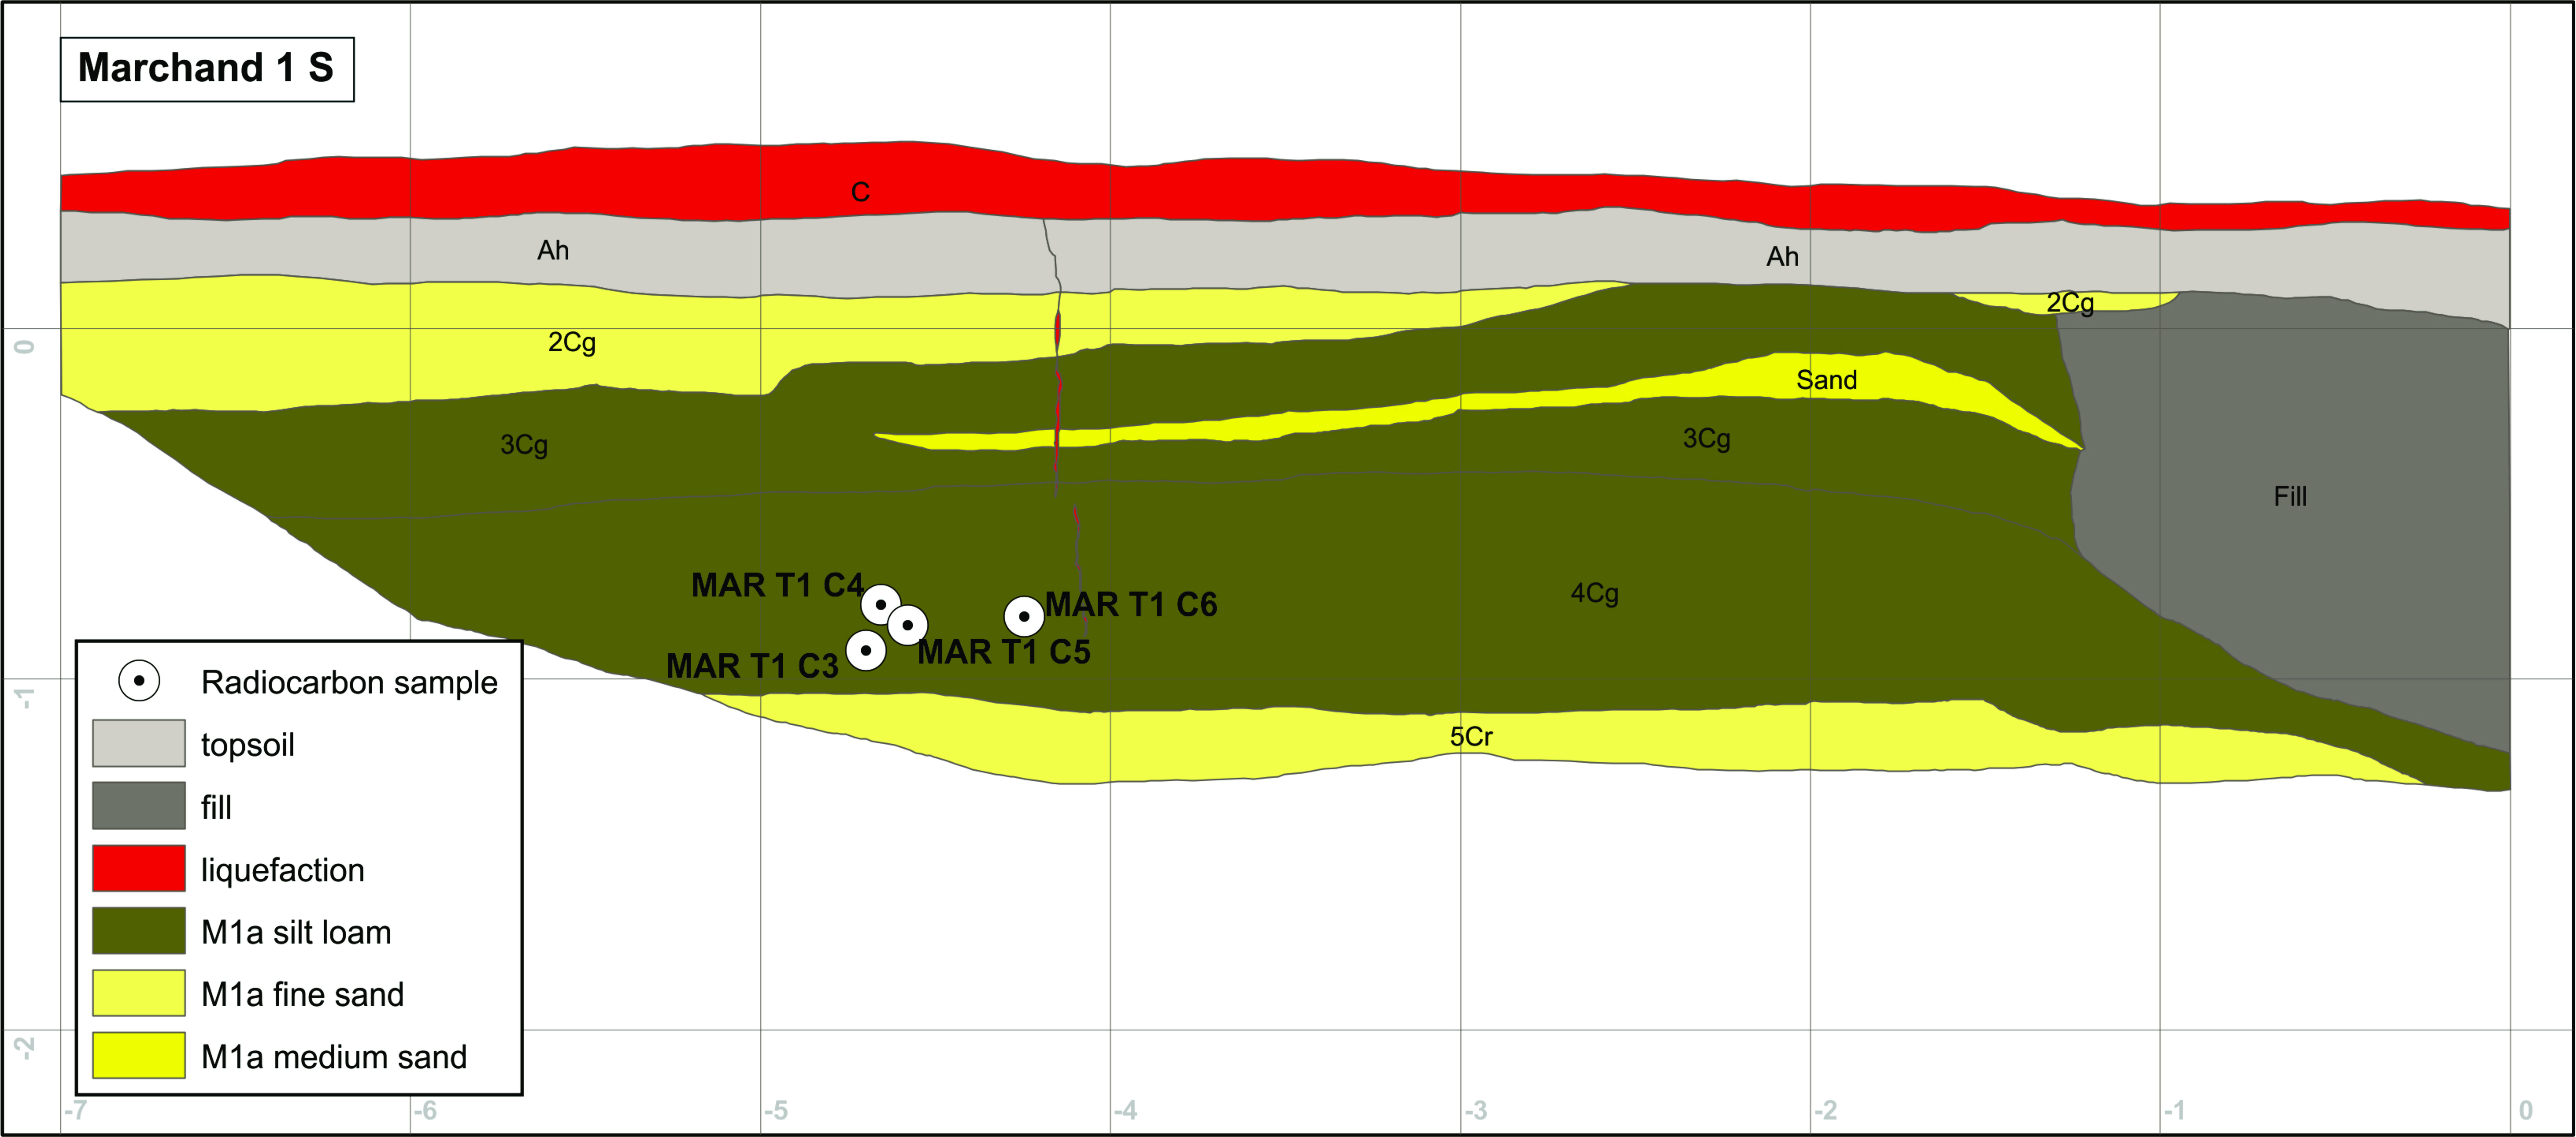
Figure S12. Trench log of MAR 1 trench southwest wall. See Table S8 for trench unit description.
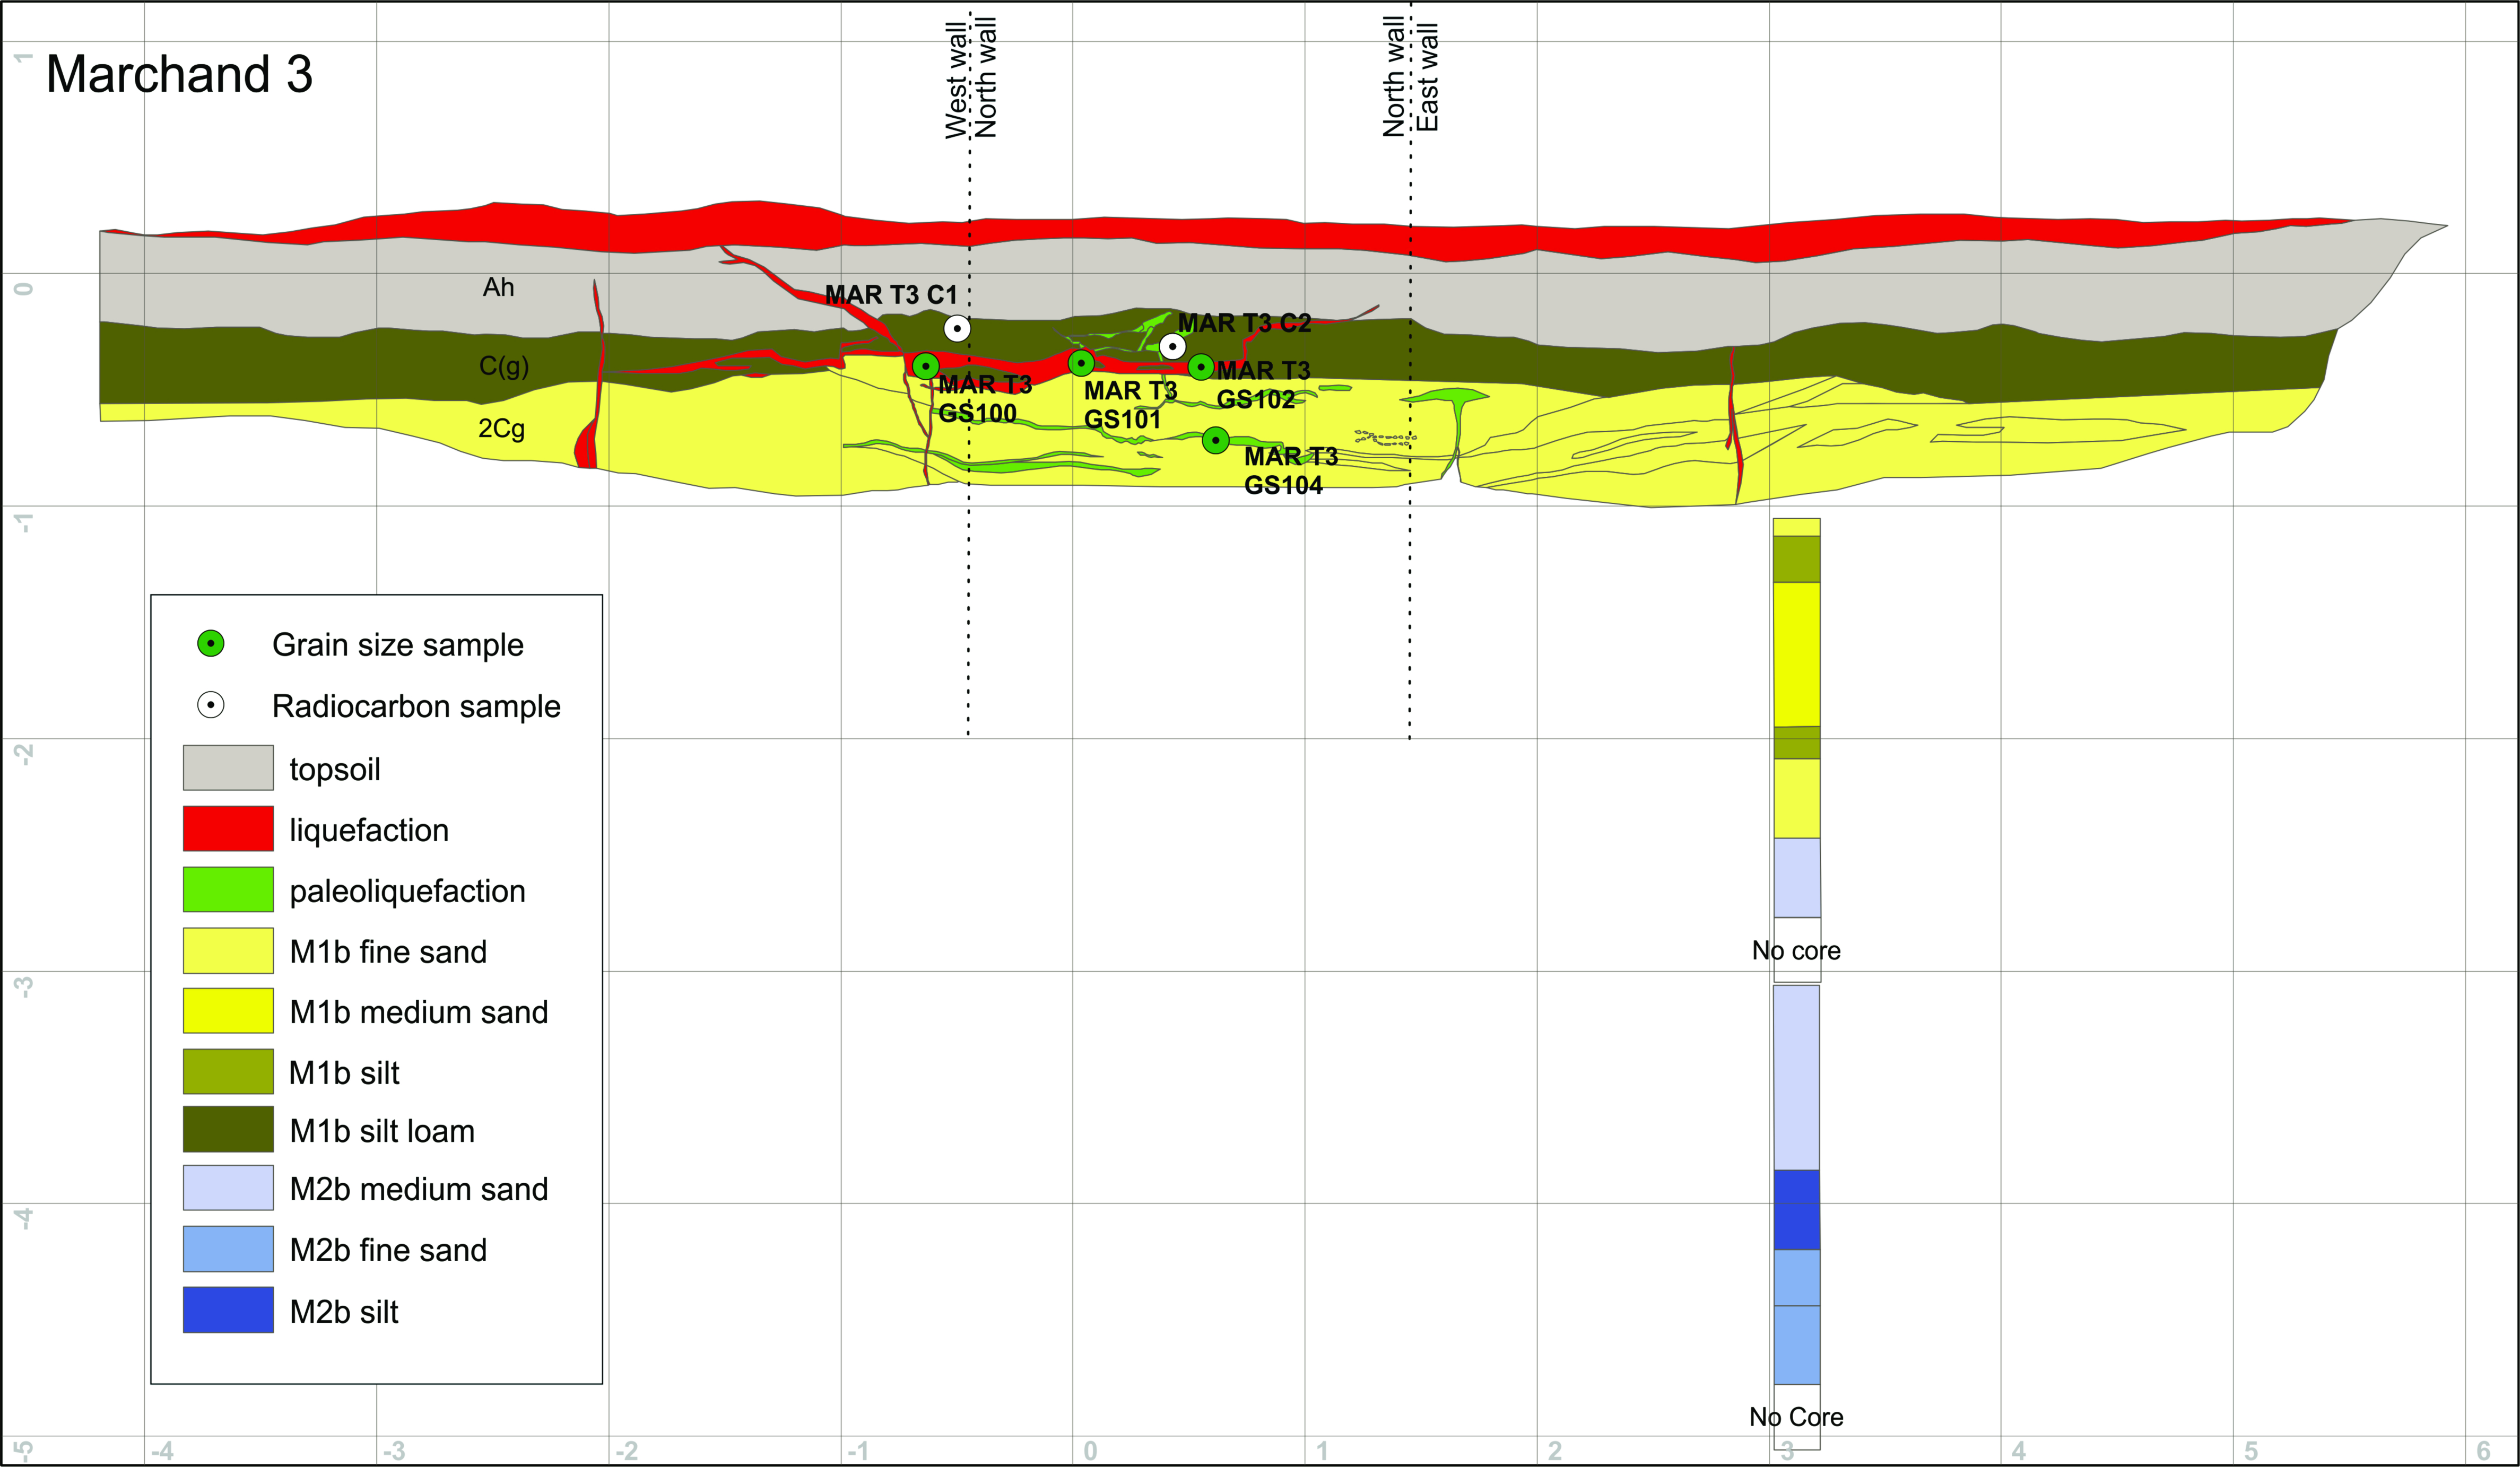
Figure S13. Trench log of MAR 3 trench. Note that west, north, and east walls are all displayed in the figure. Core is core MAR 3-1. See Table S9 for trench unit description.
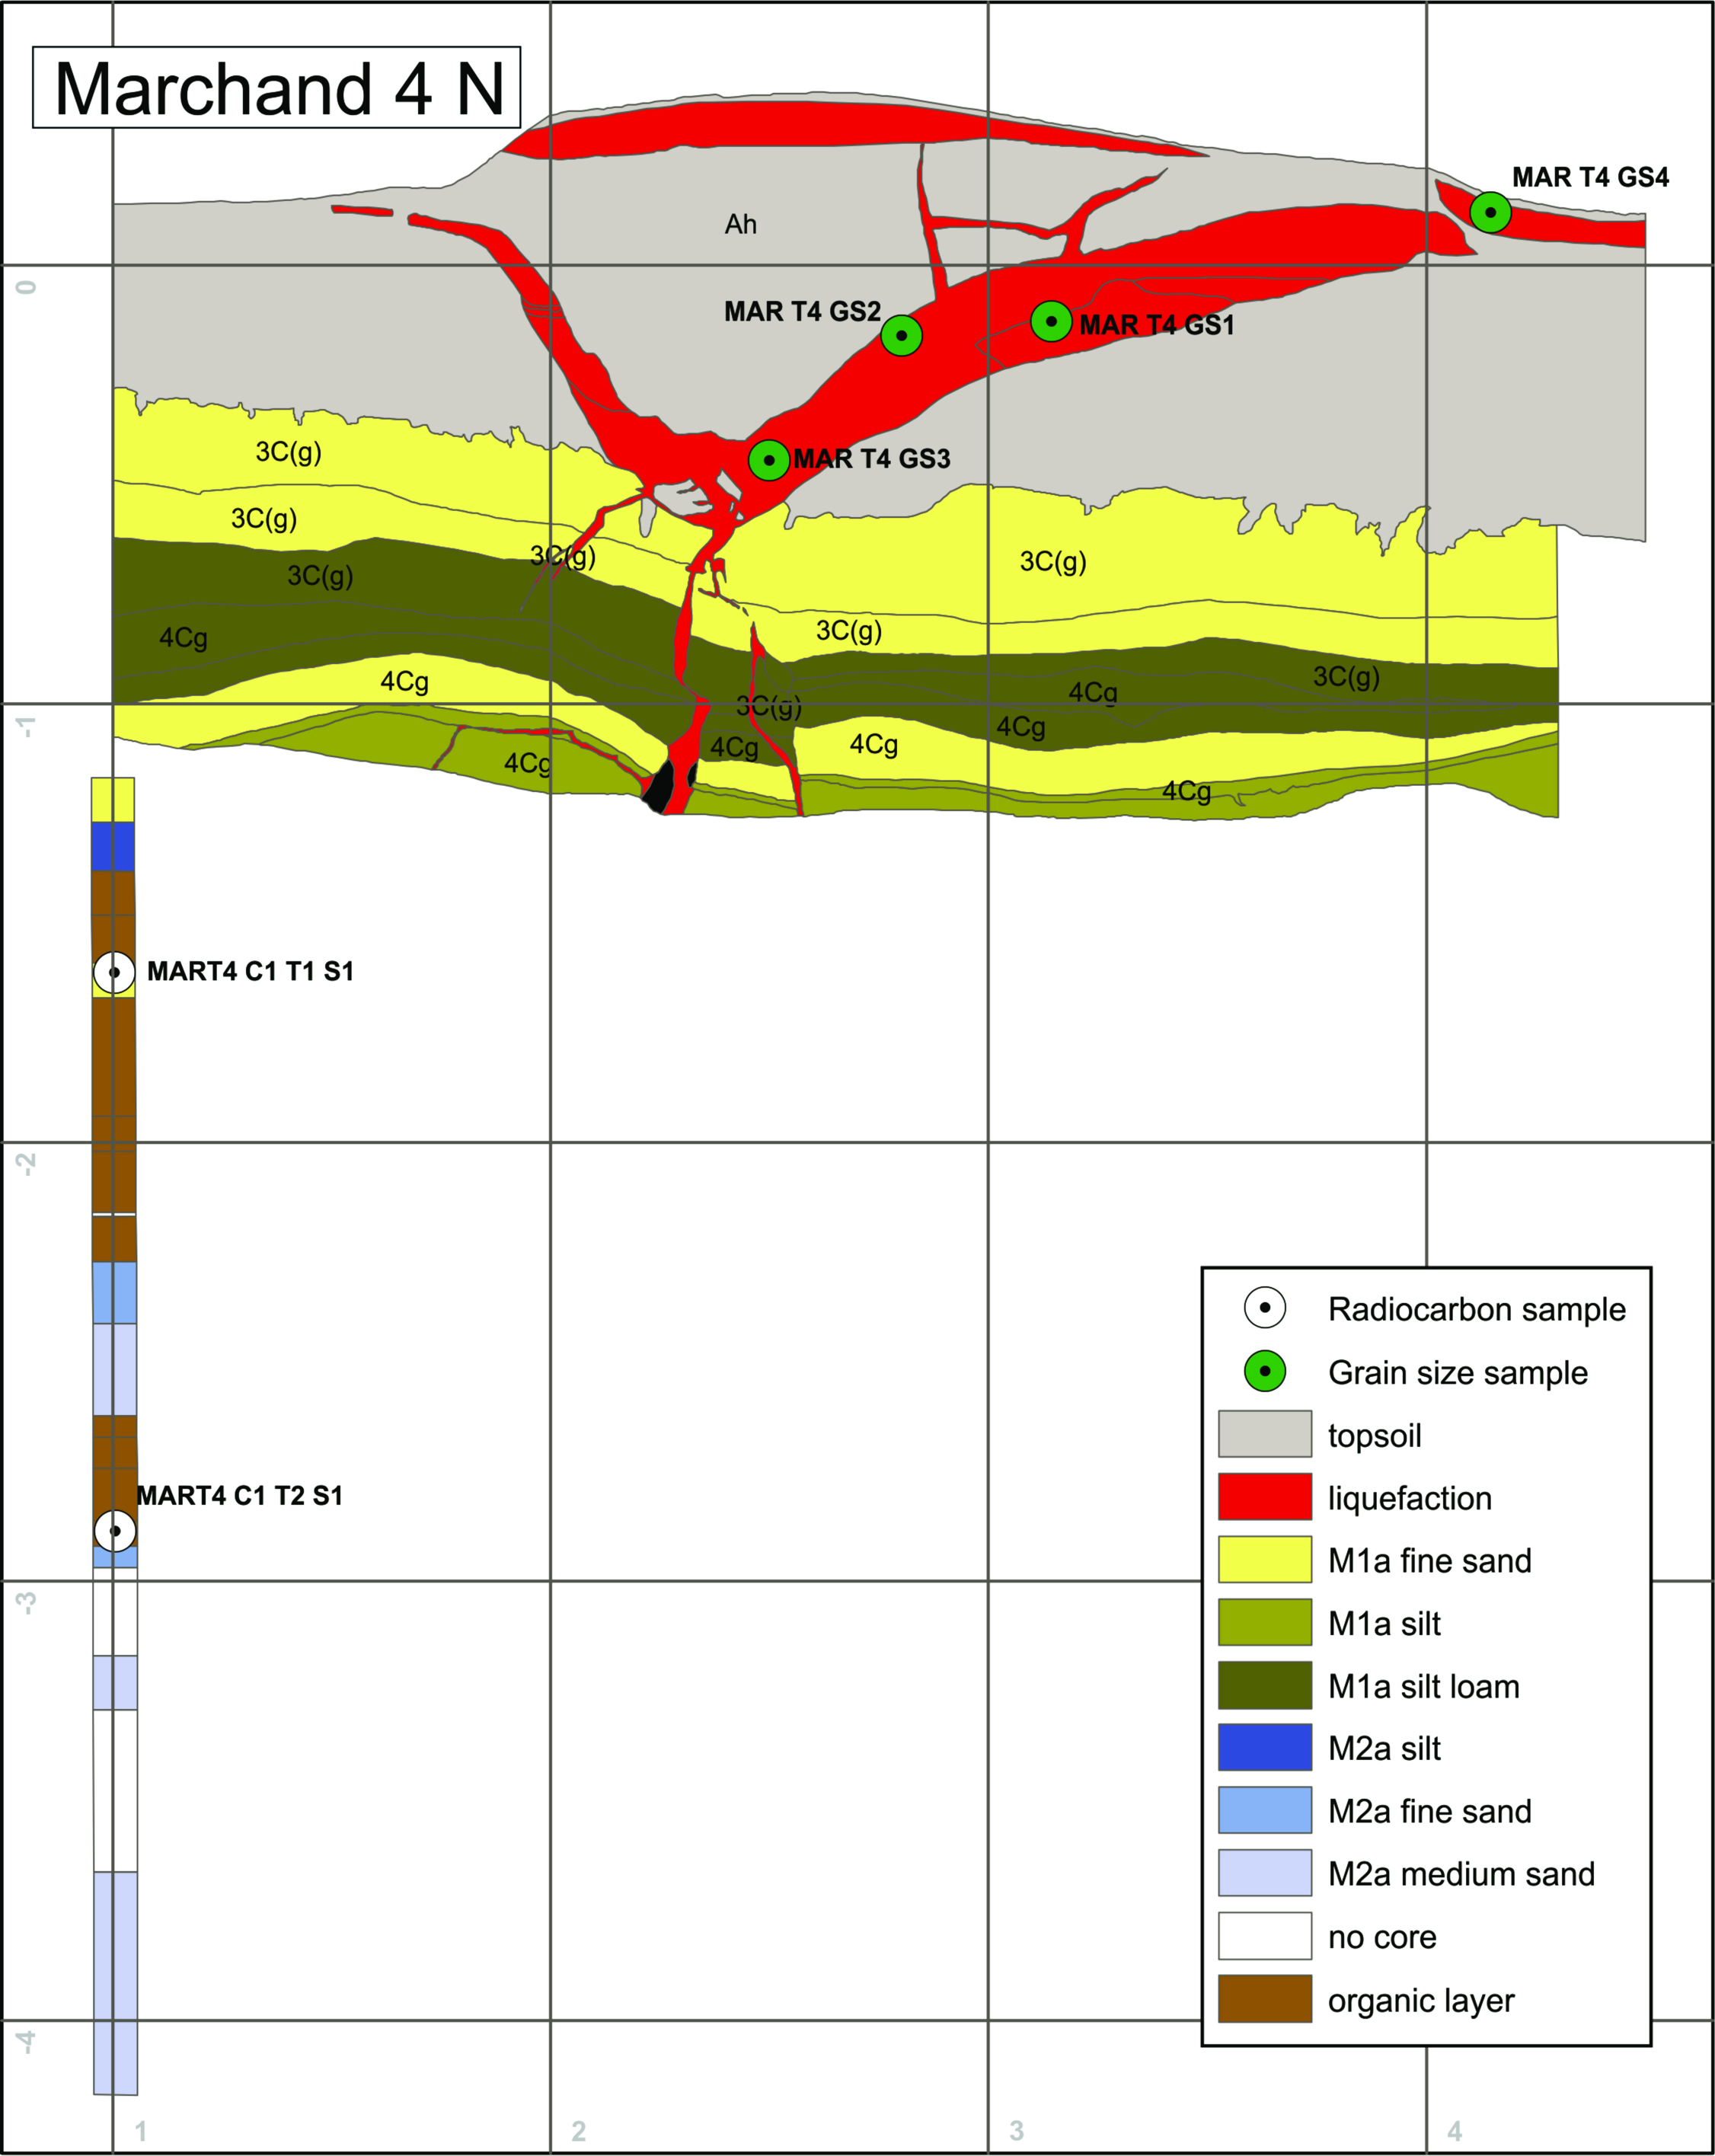
Figure S14. Trench log of MAR 4 trench north wall with log of core MAR 4-1. Note that the south wall was not logged. See Table S10 for trench unit description.
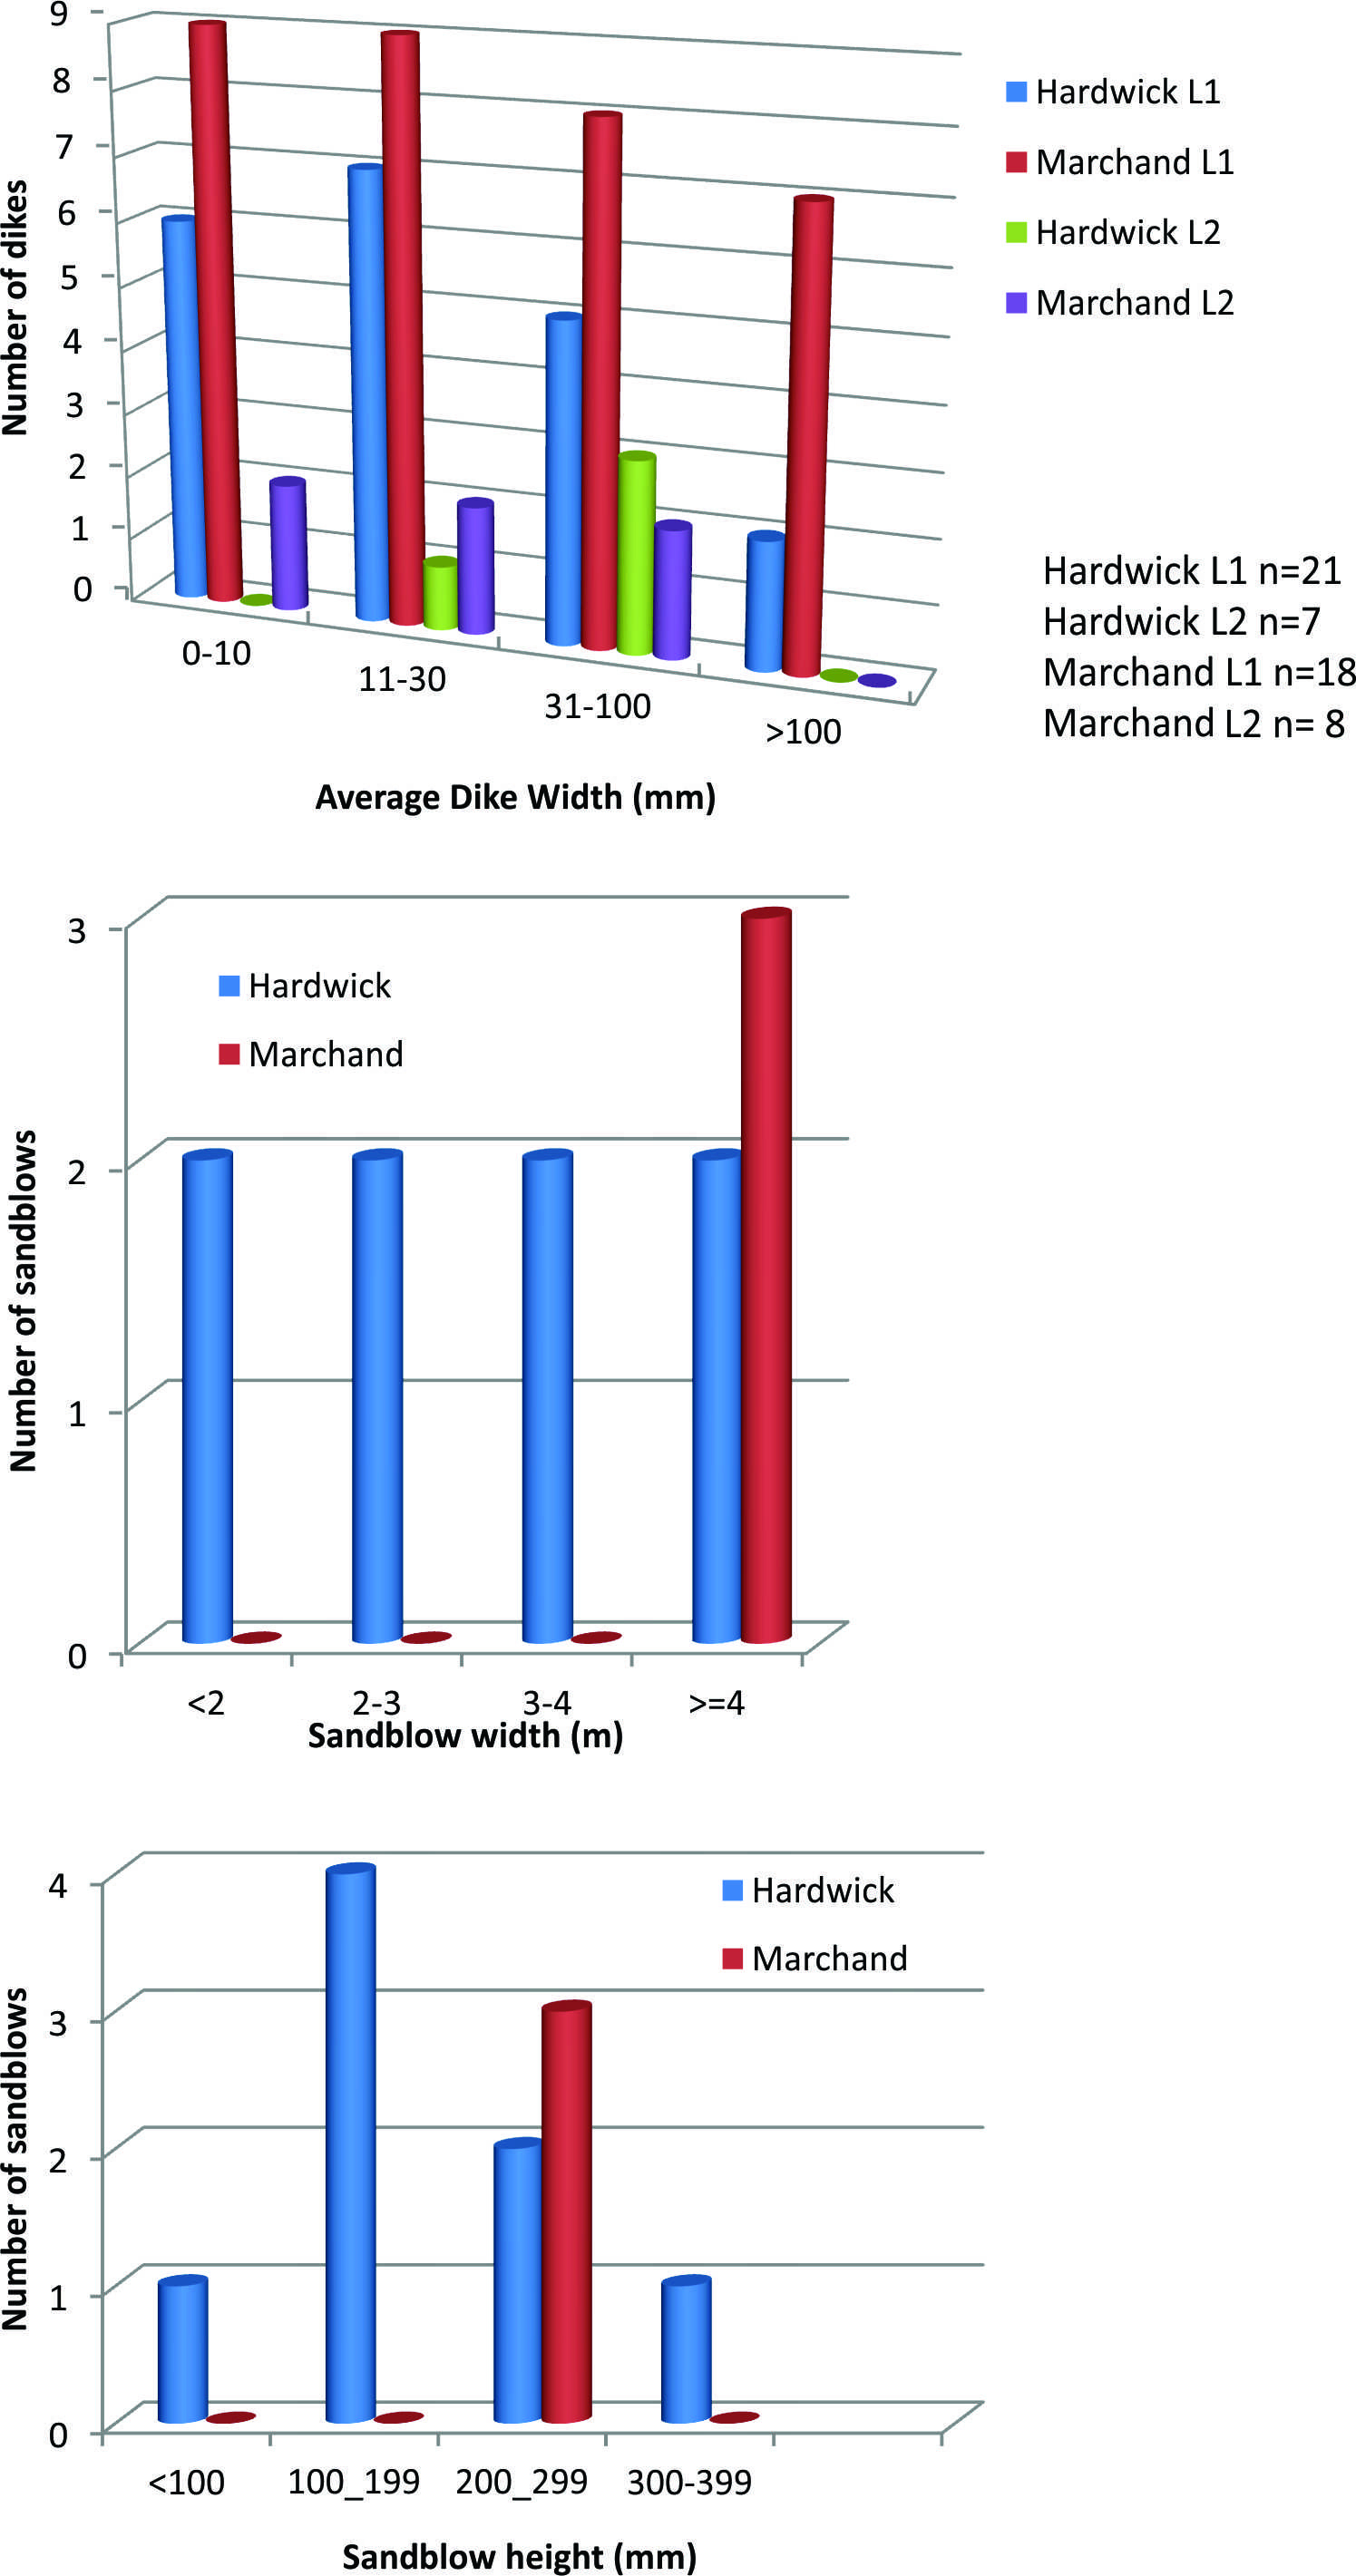
Figure S15. Comparative plots of dike and sand-blow sizes for the 2010–2011 liquefaction and for the paleoliquefaction features observed at the Hardwick and Marchand trenches: (top) average dike widths for modern (L1) and paleodikes (L2), (middle) average sand-blow width, and (bottom) average sand-blow height (thickness). See Table S11 for data.
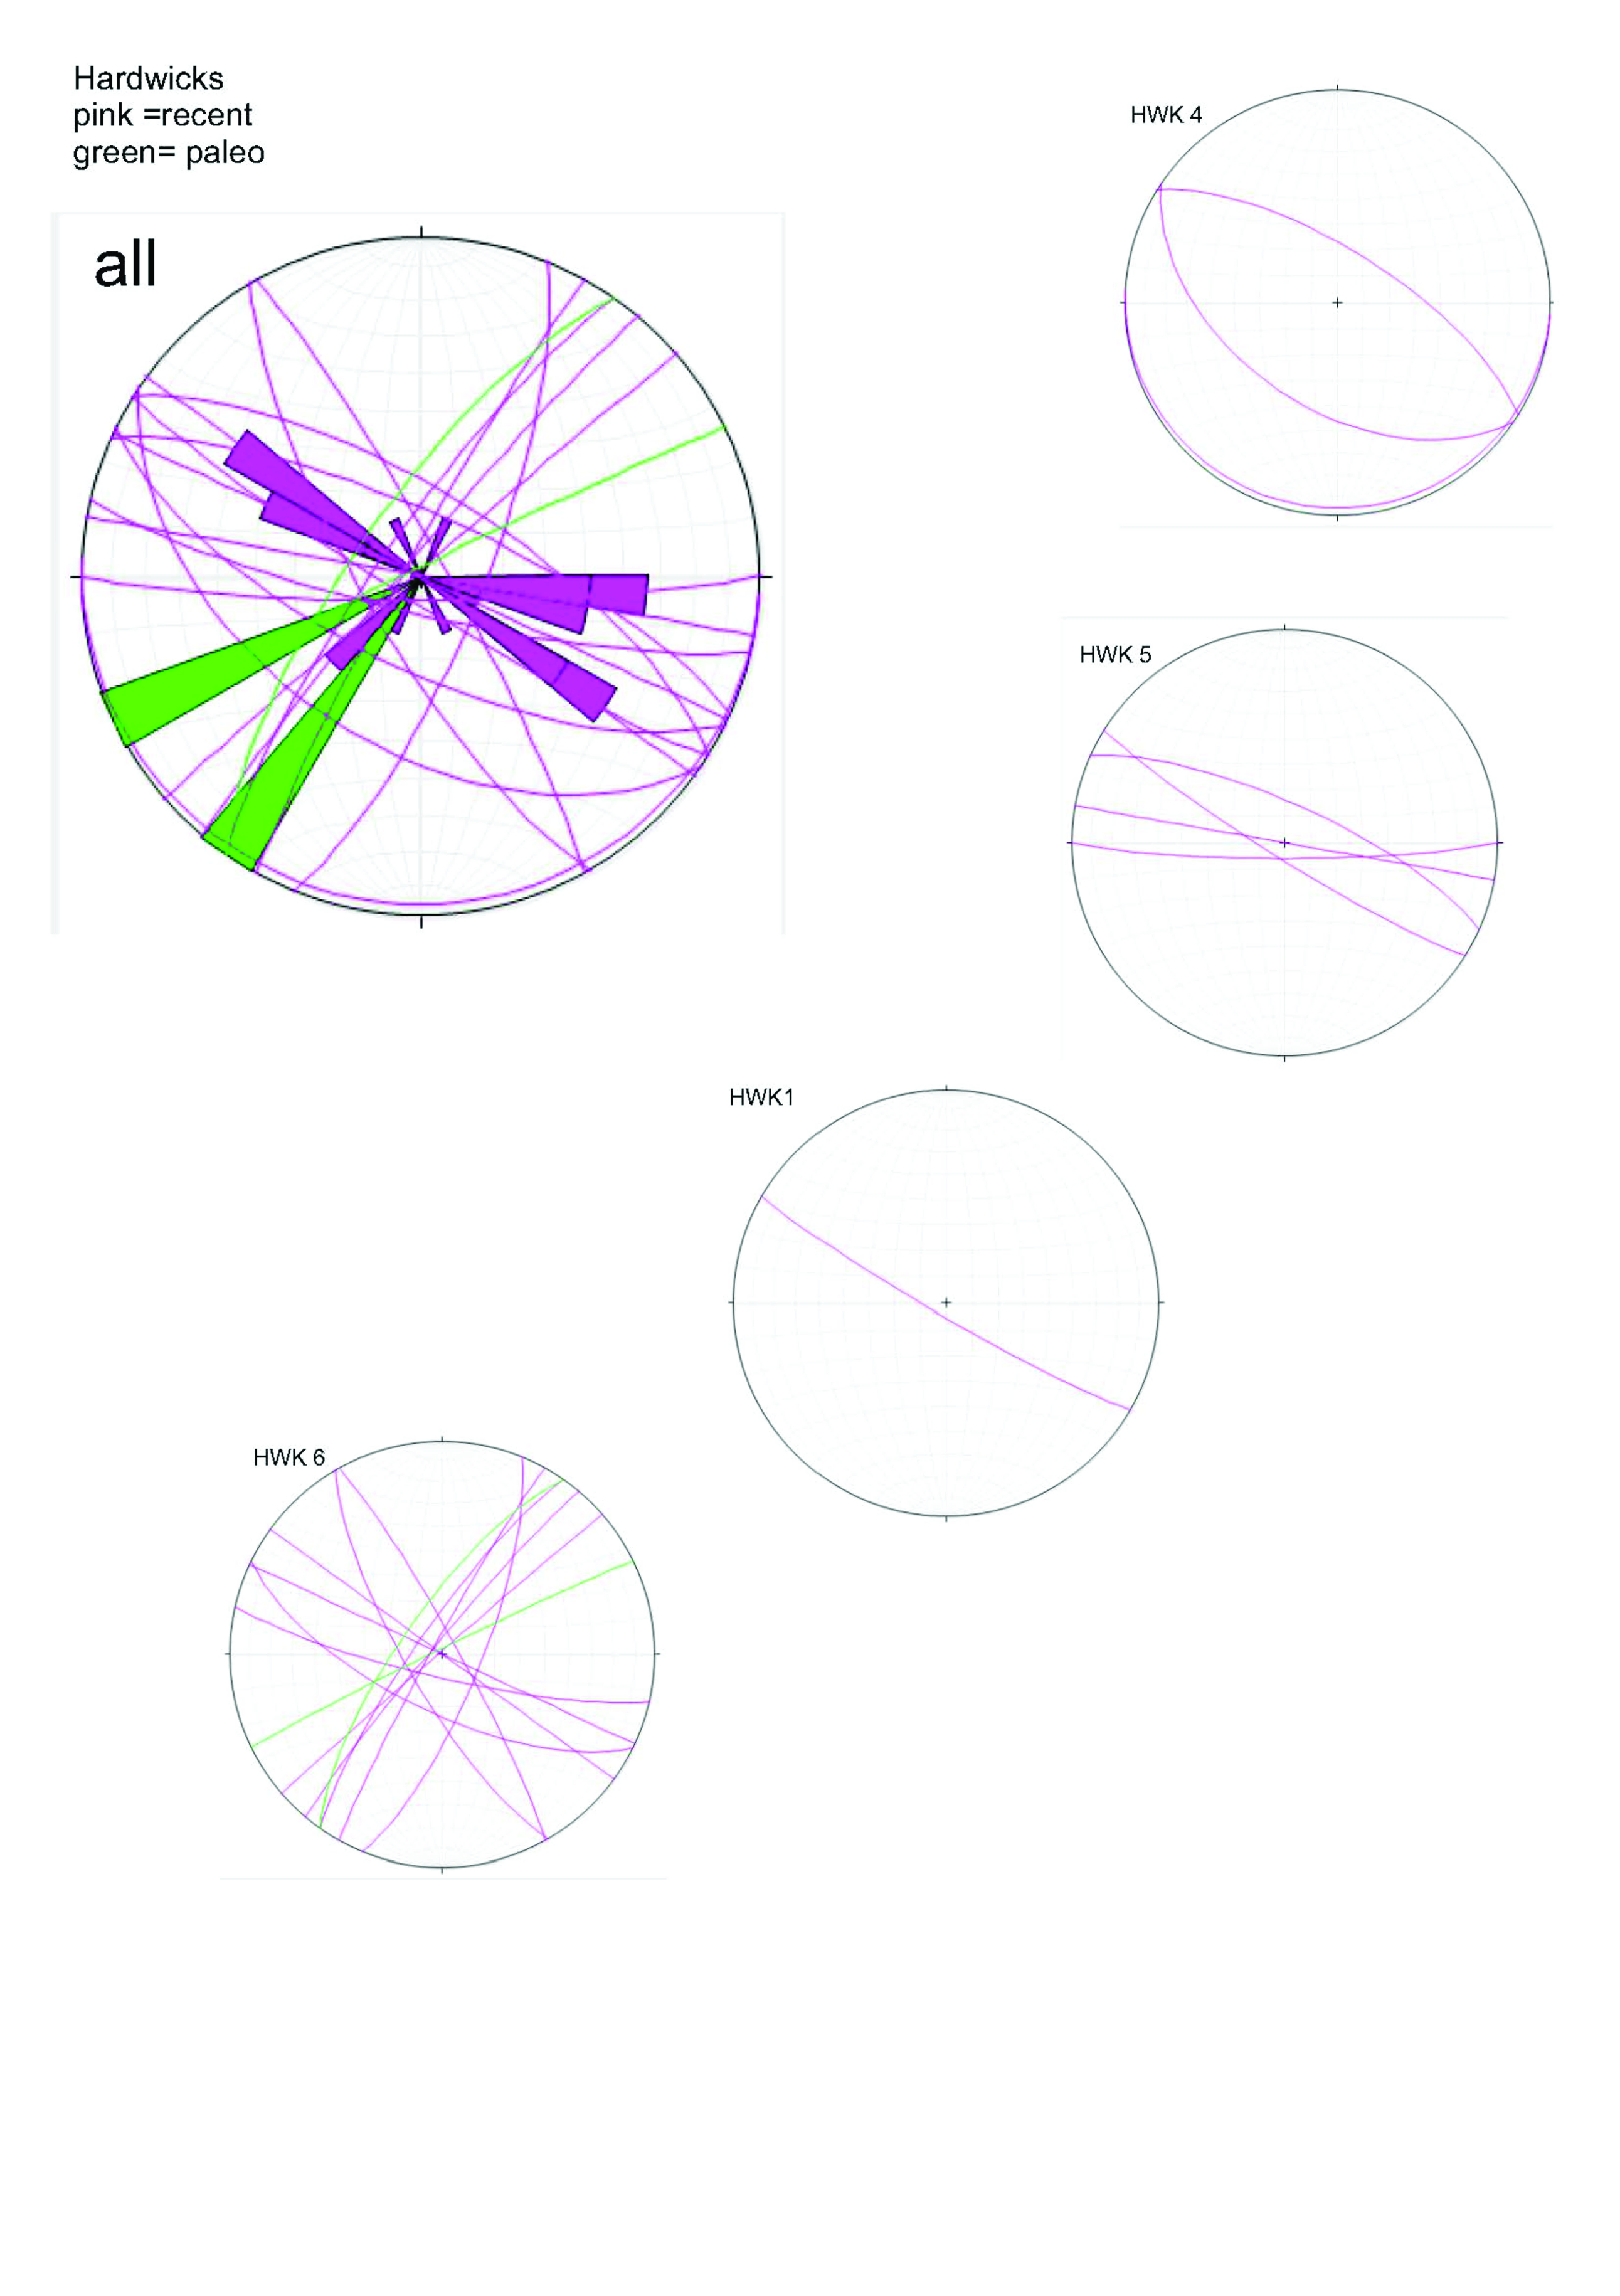
Figure S16. Stereonet plots of dike strikes measured in the trenches: Hardwick site.
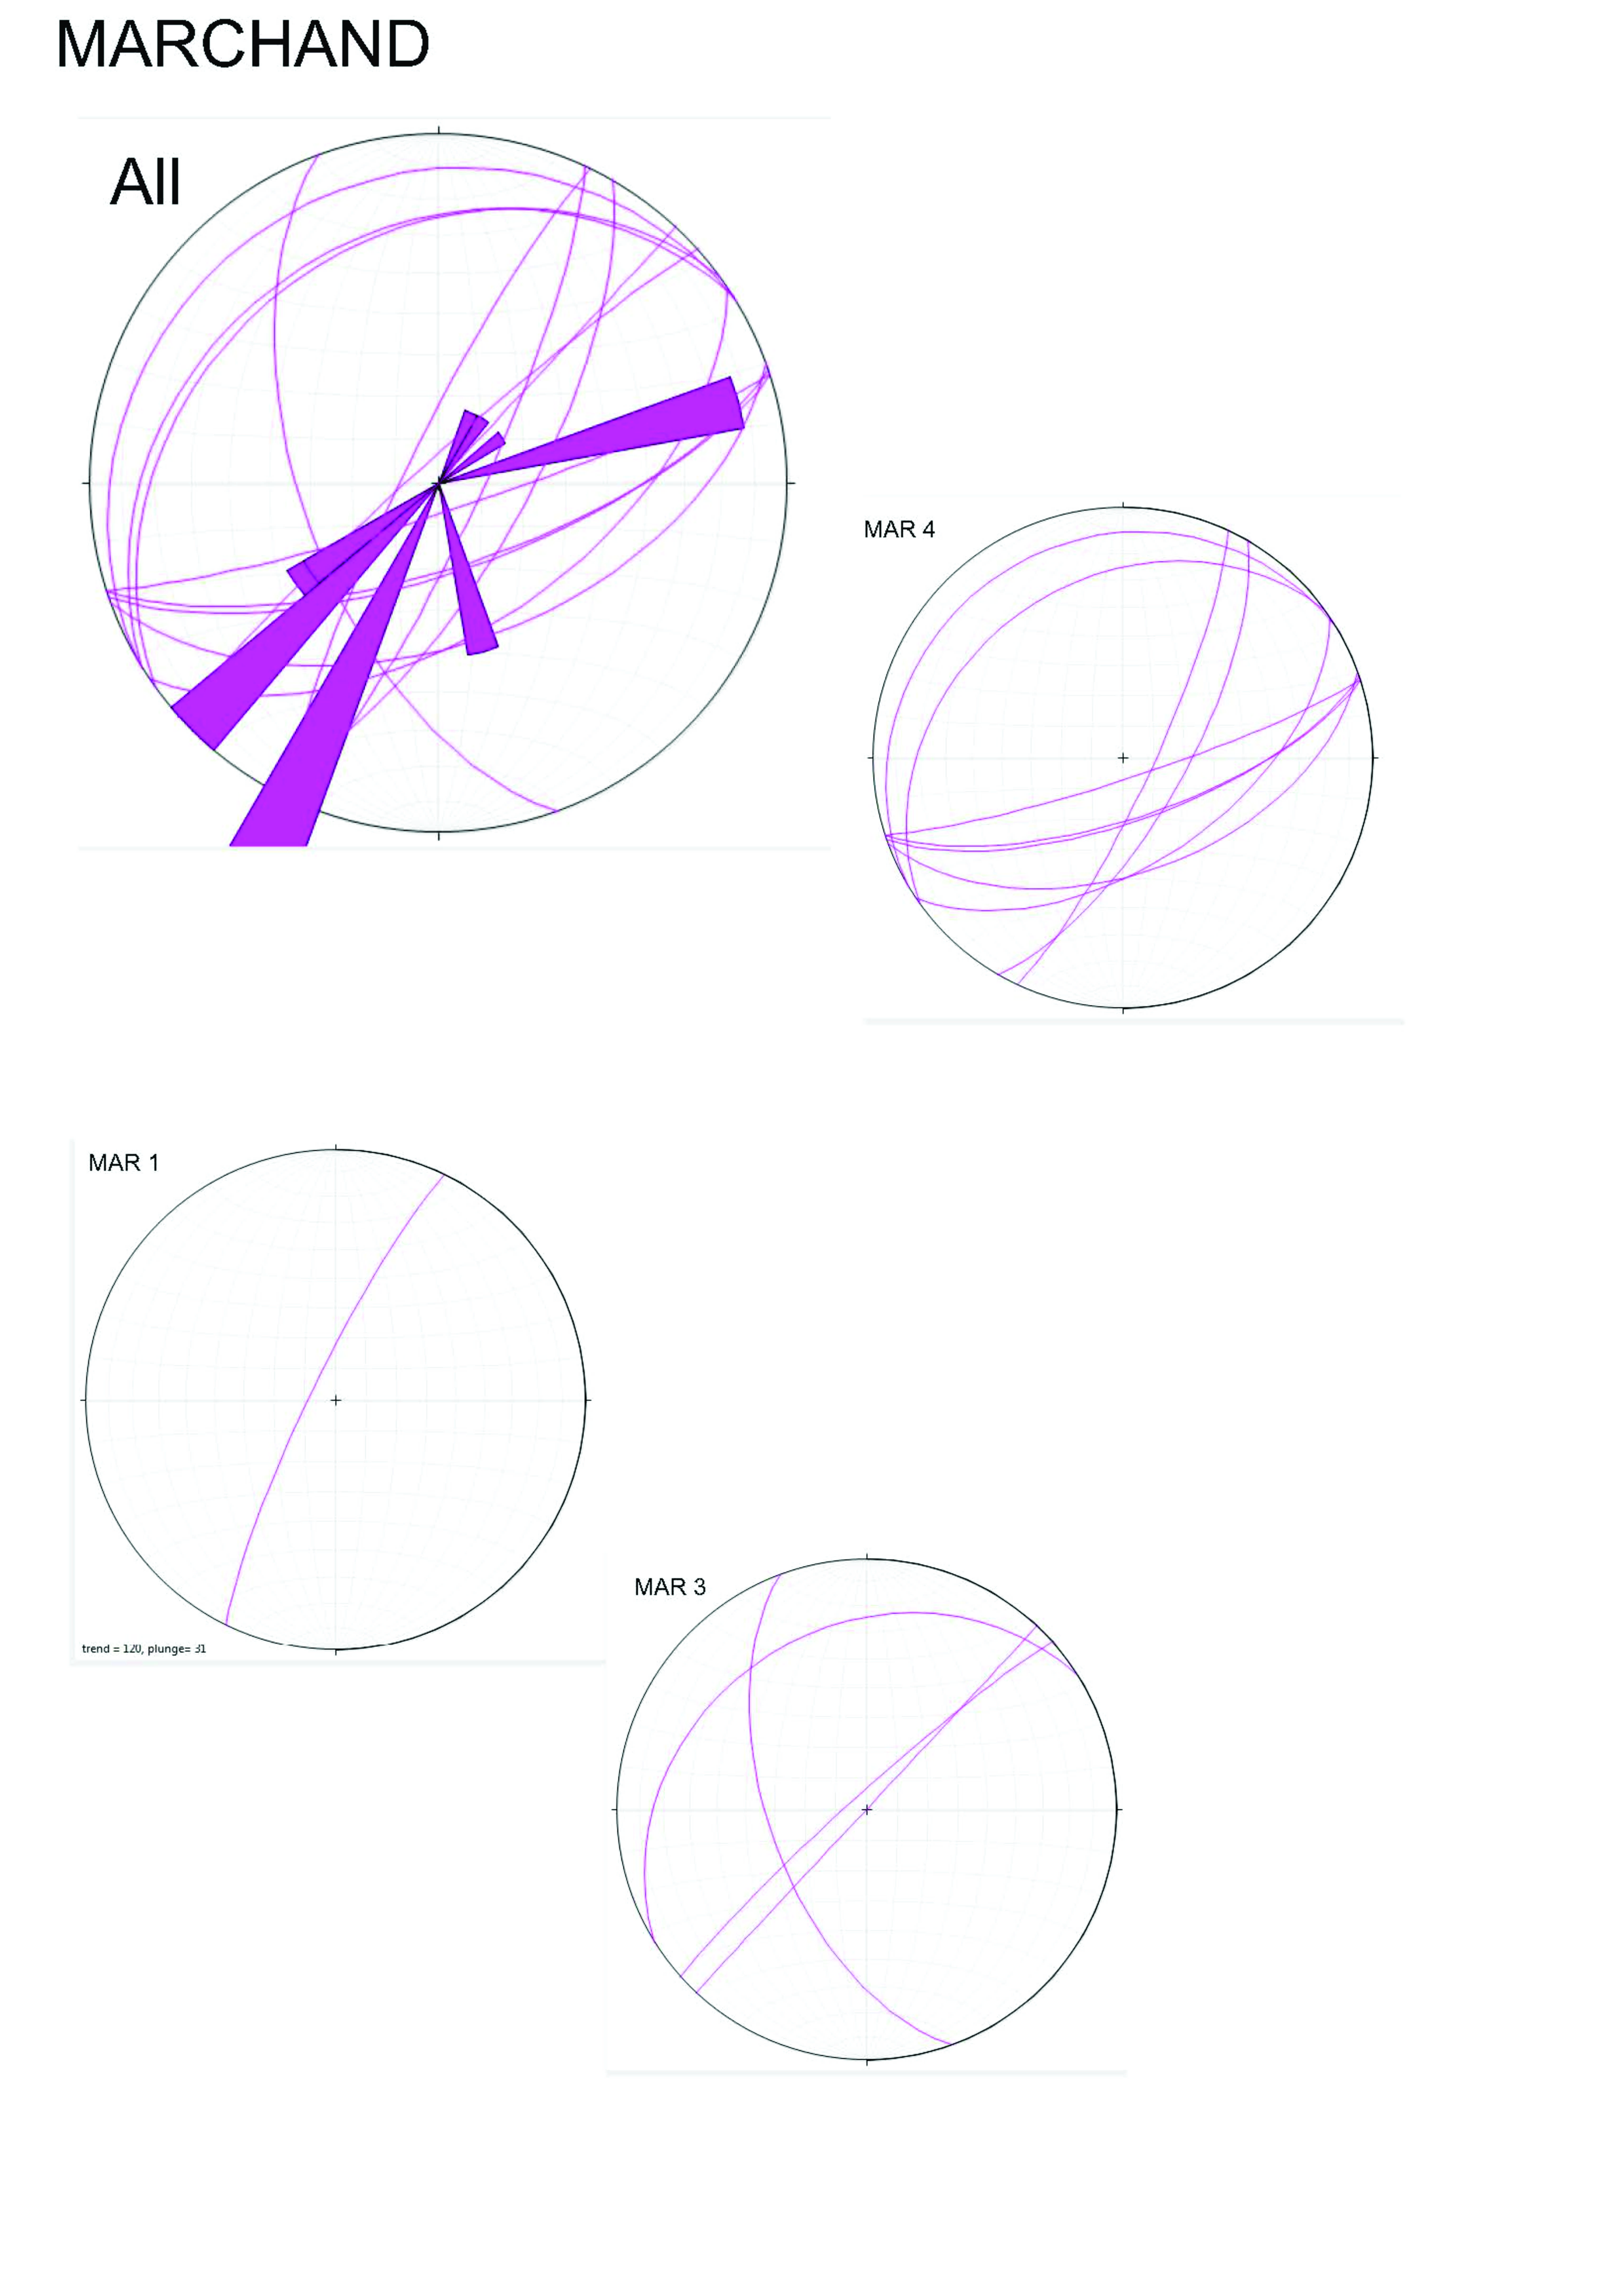
Figure S17. Stereonet plots of dike strikes measured in the trenches: Marchand site.
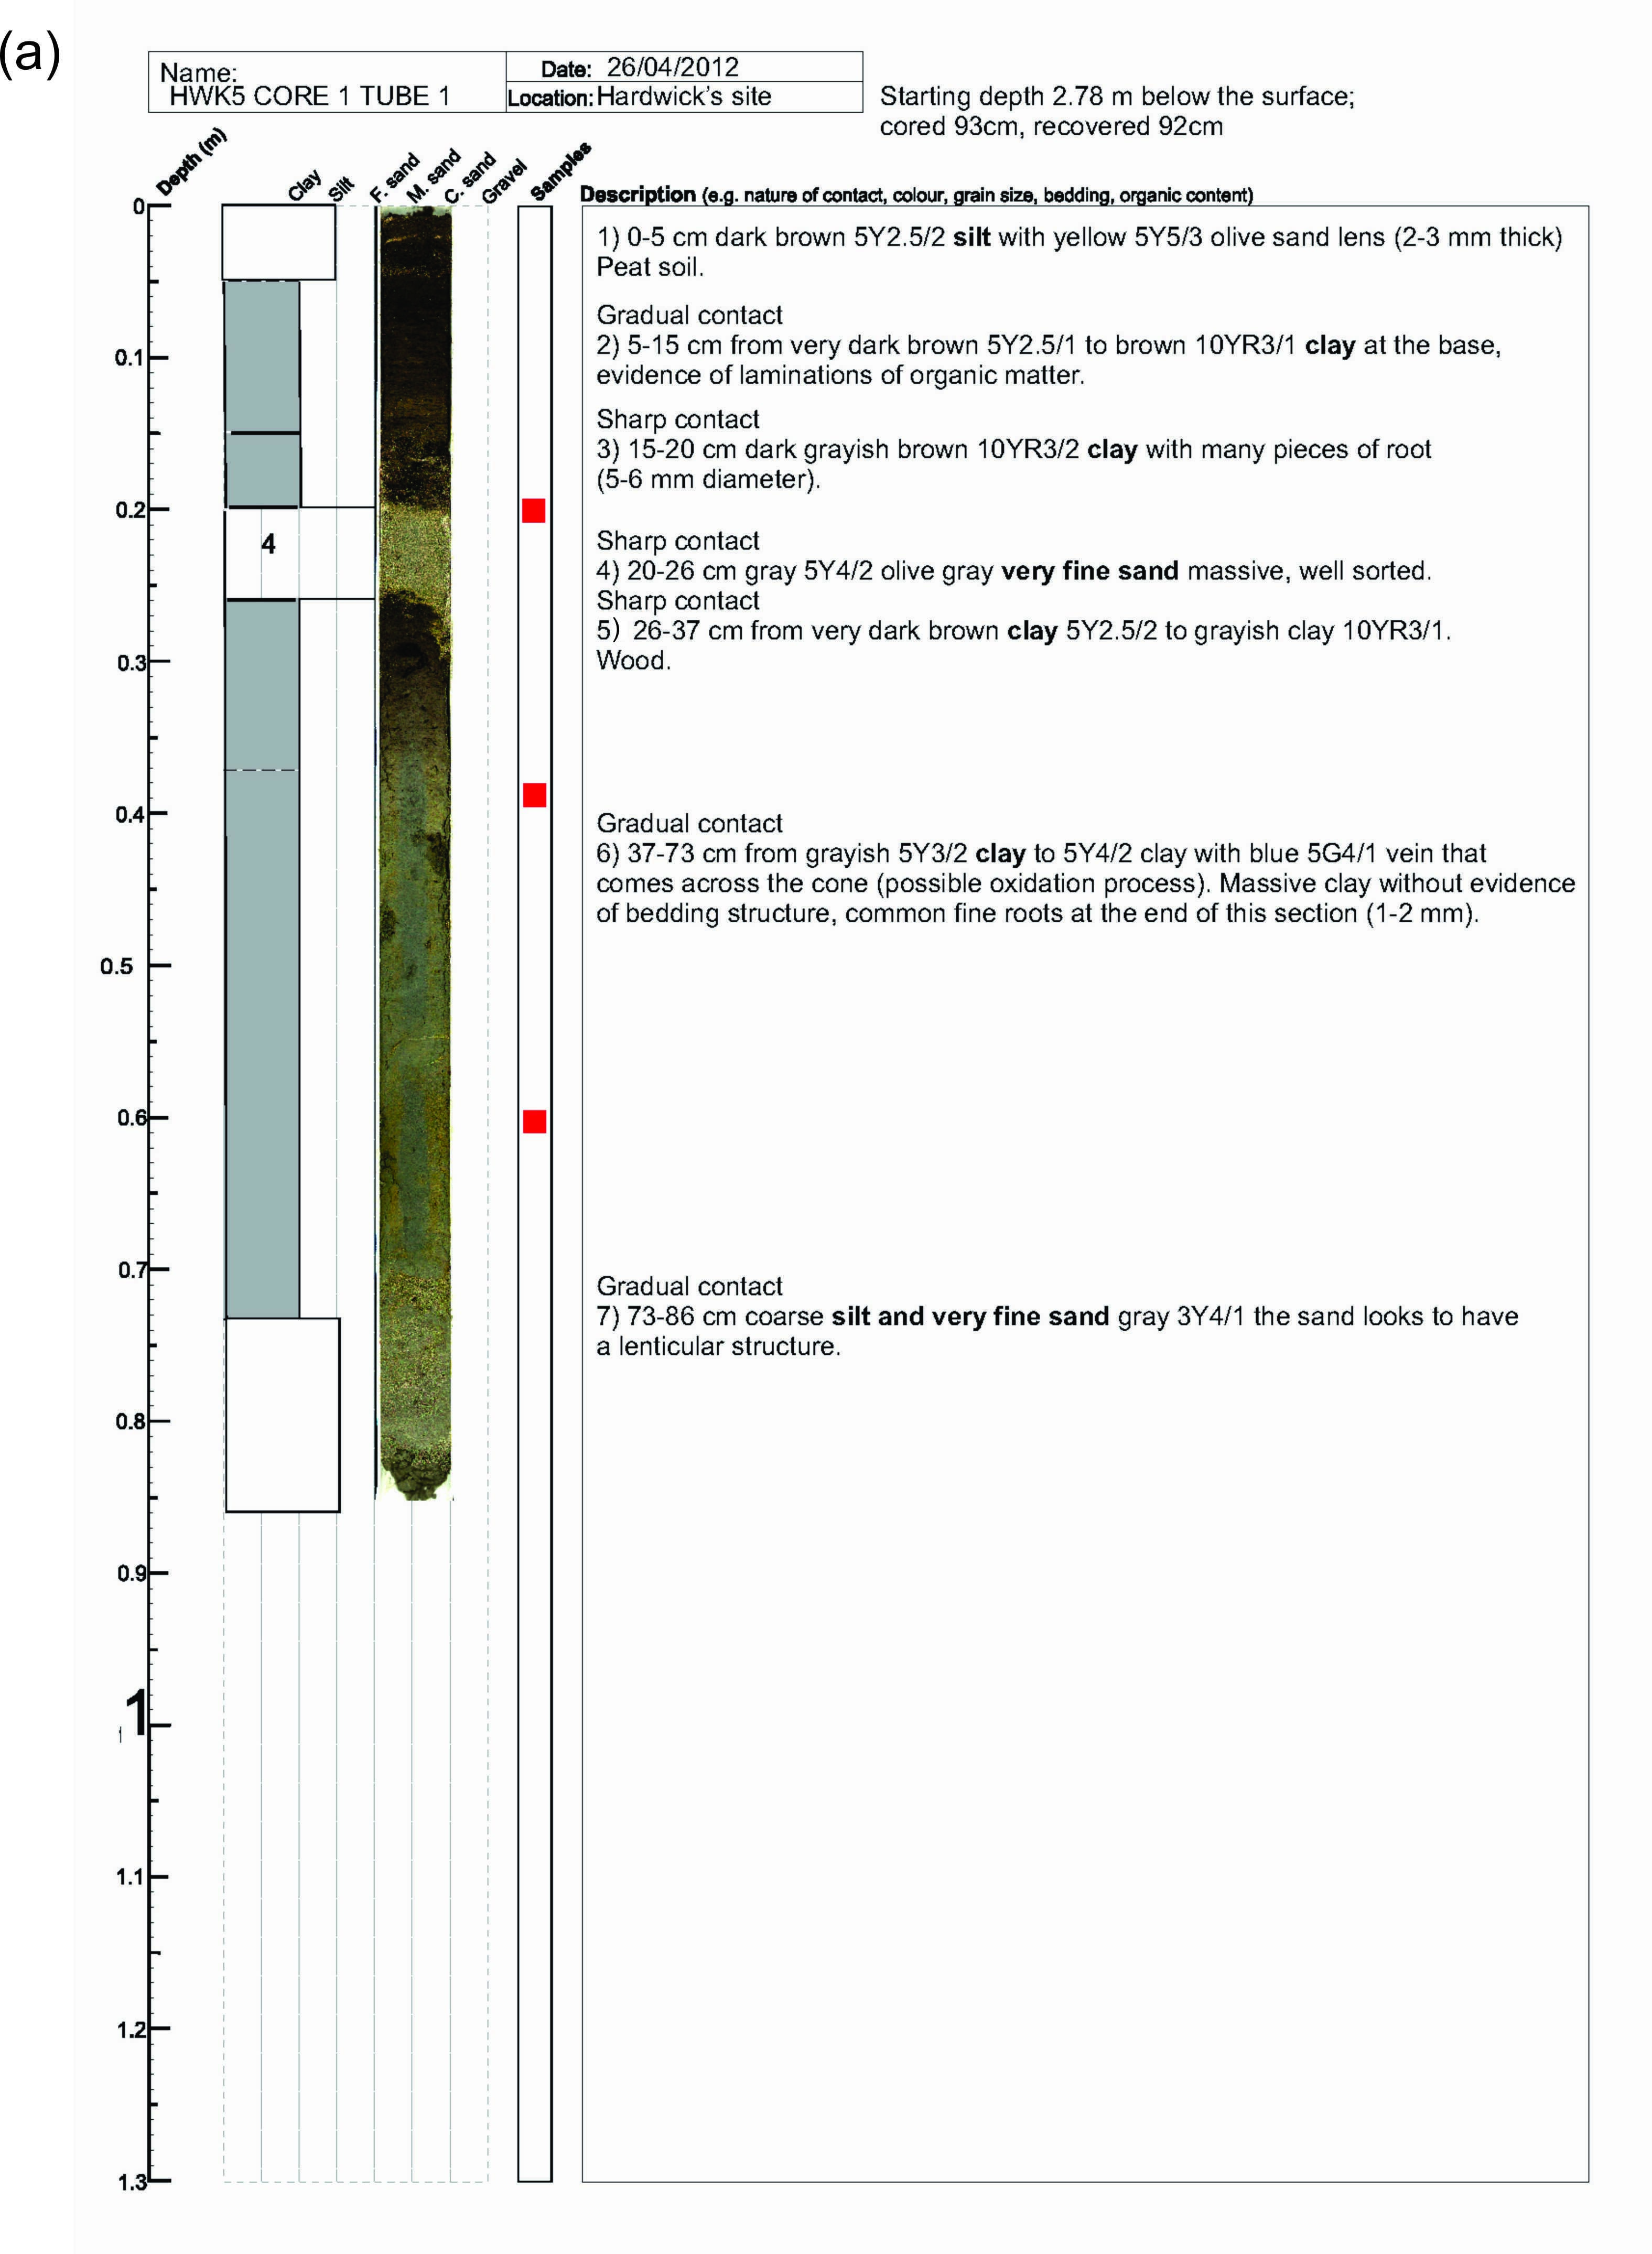
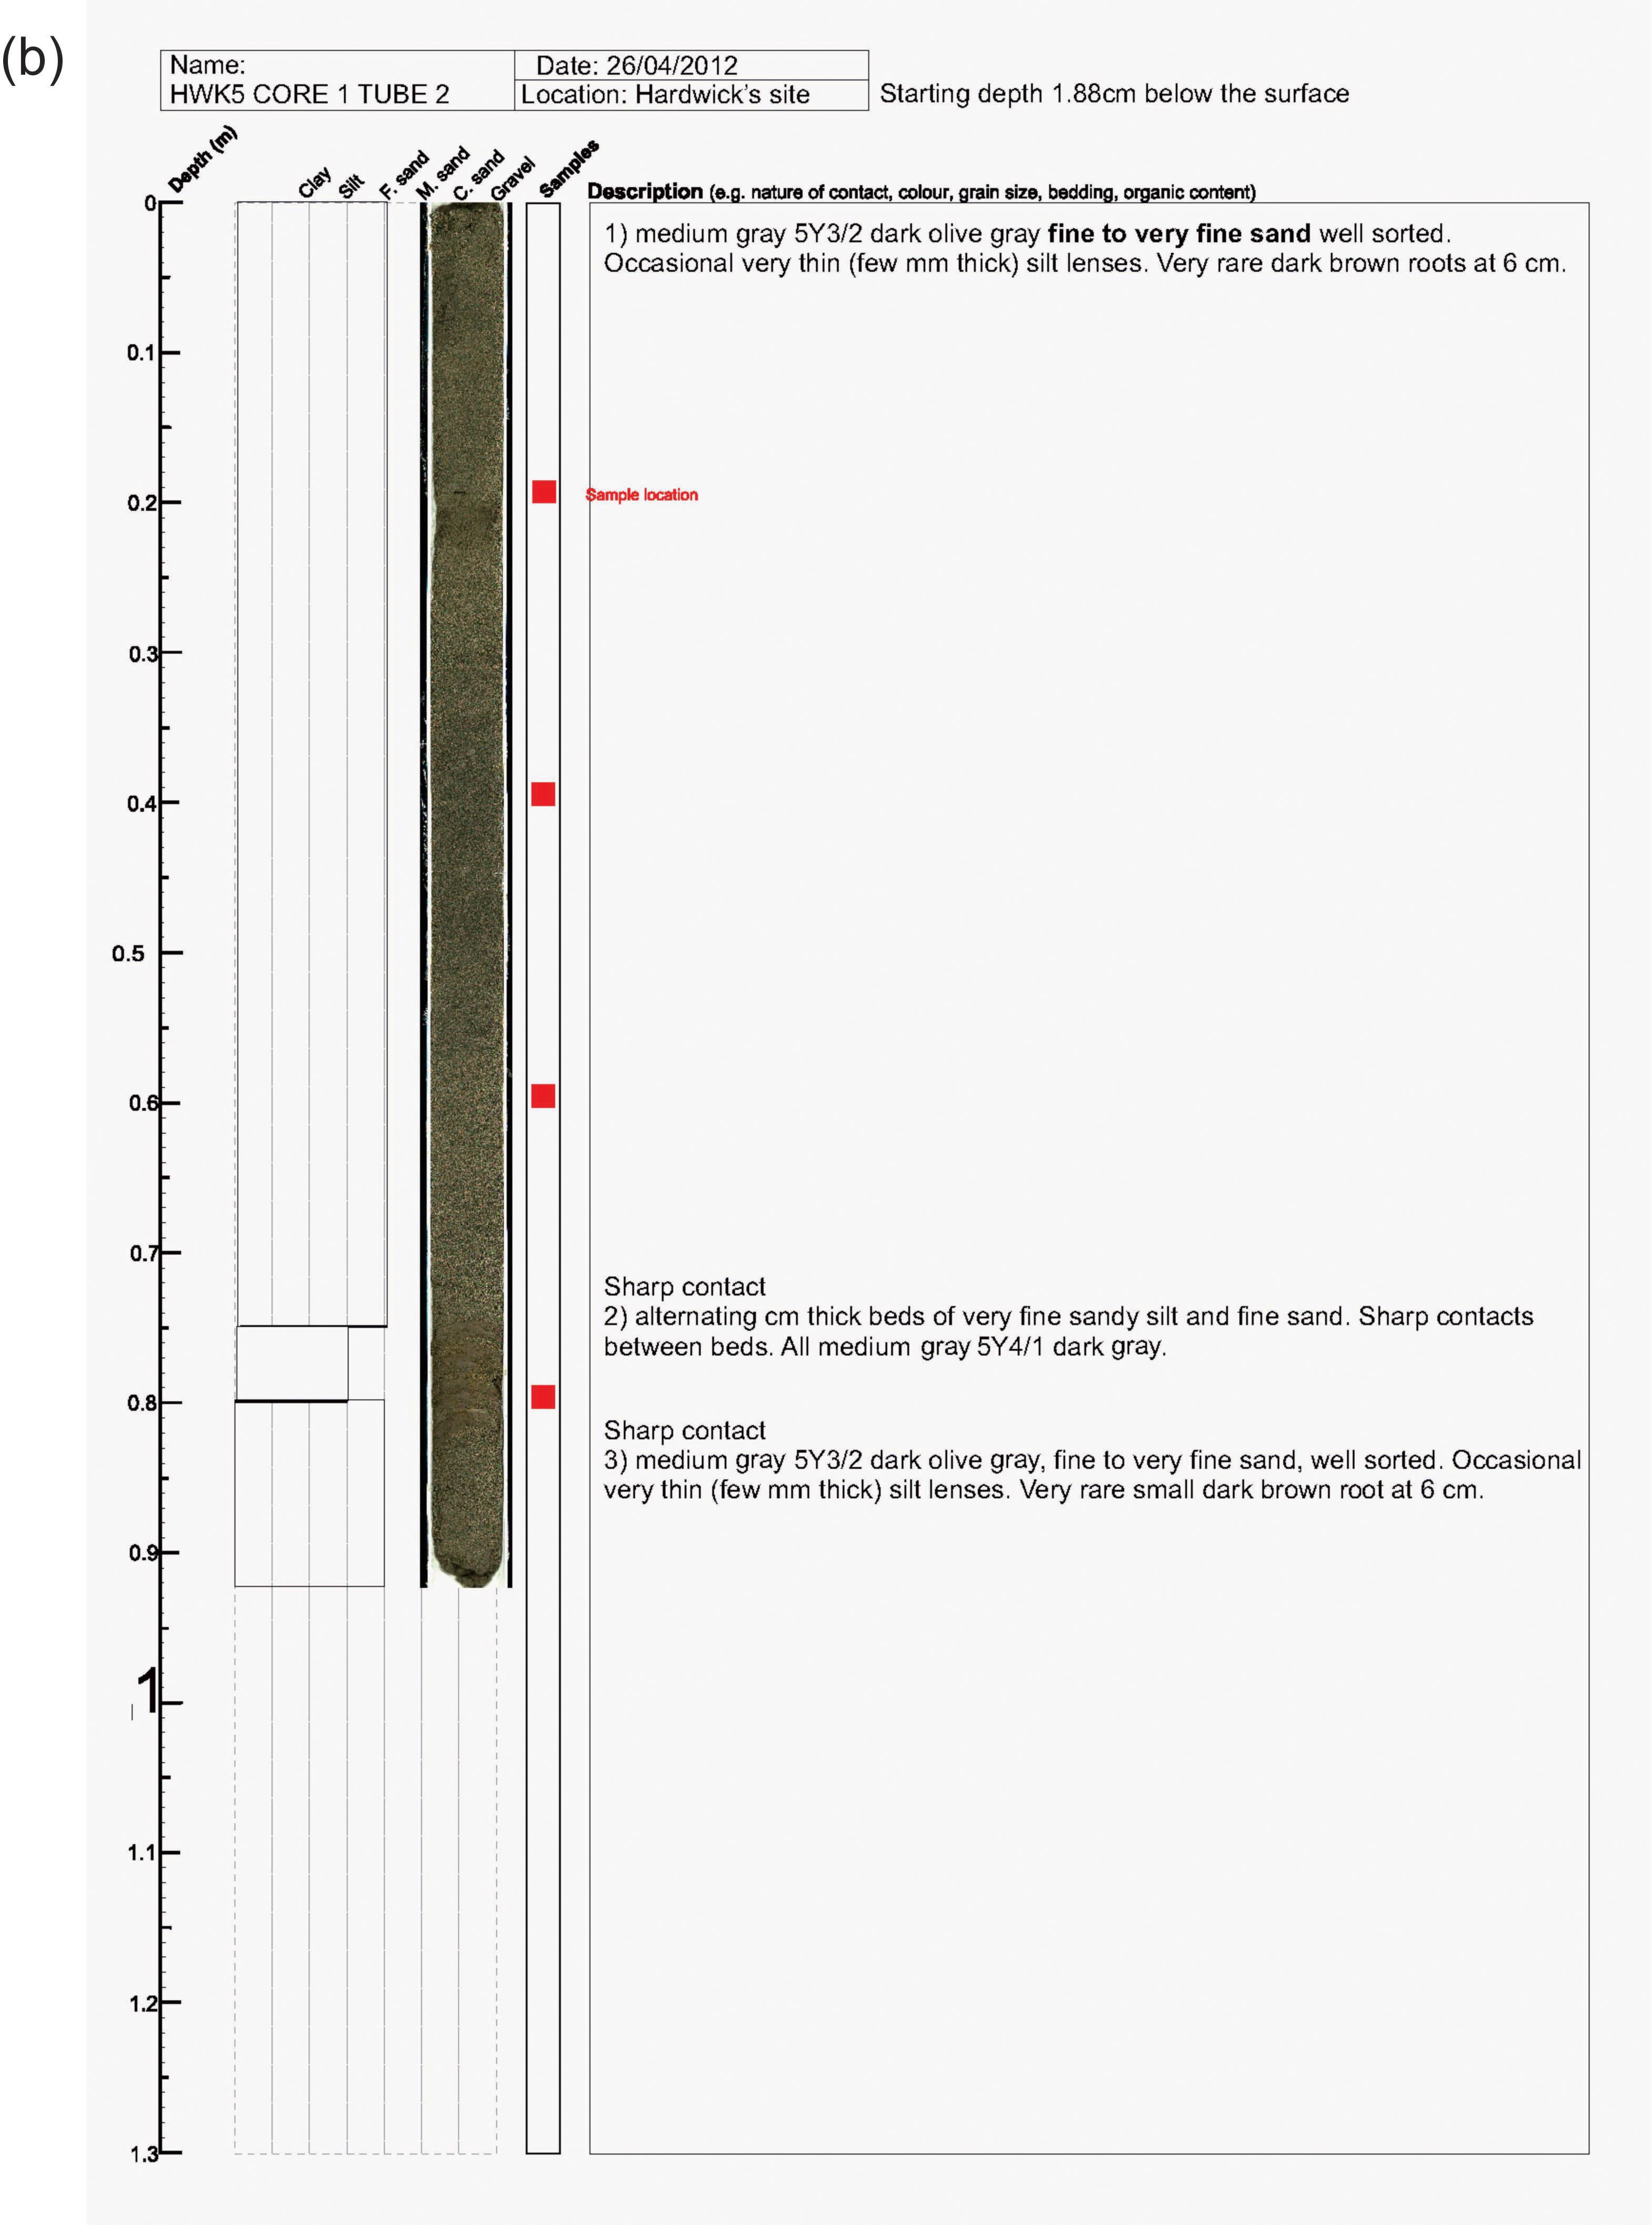
Figure S18. Log and unit descriptions of core HWK 5-1: (a) tube 1 and (b) tube 2.
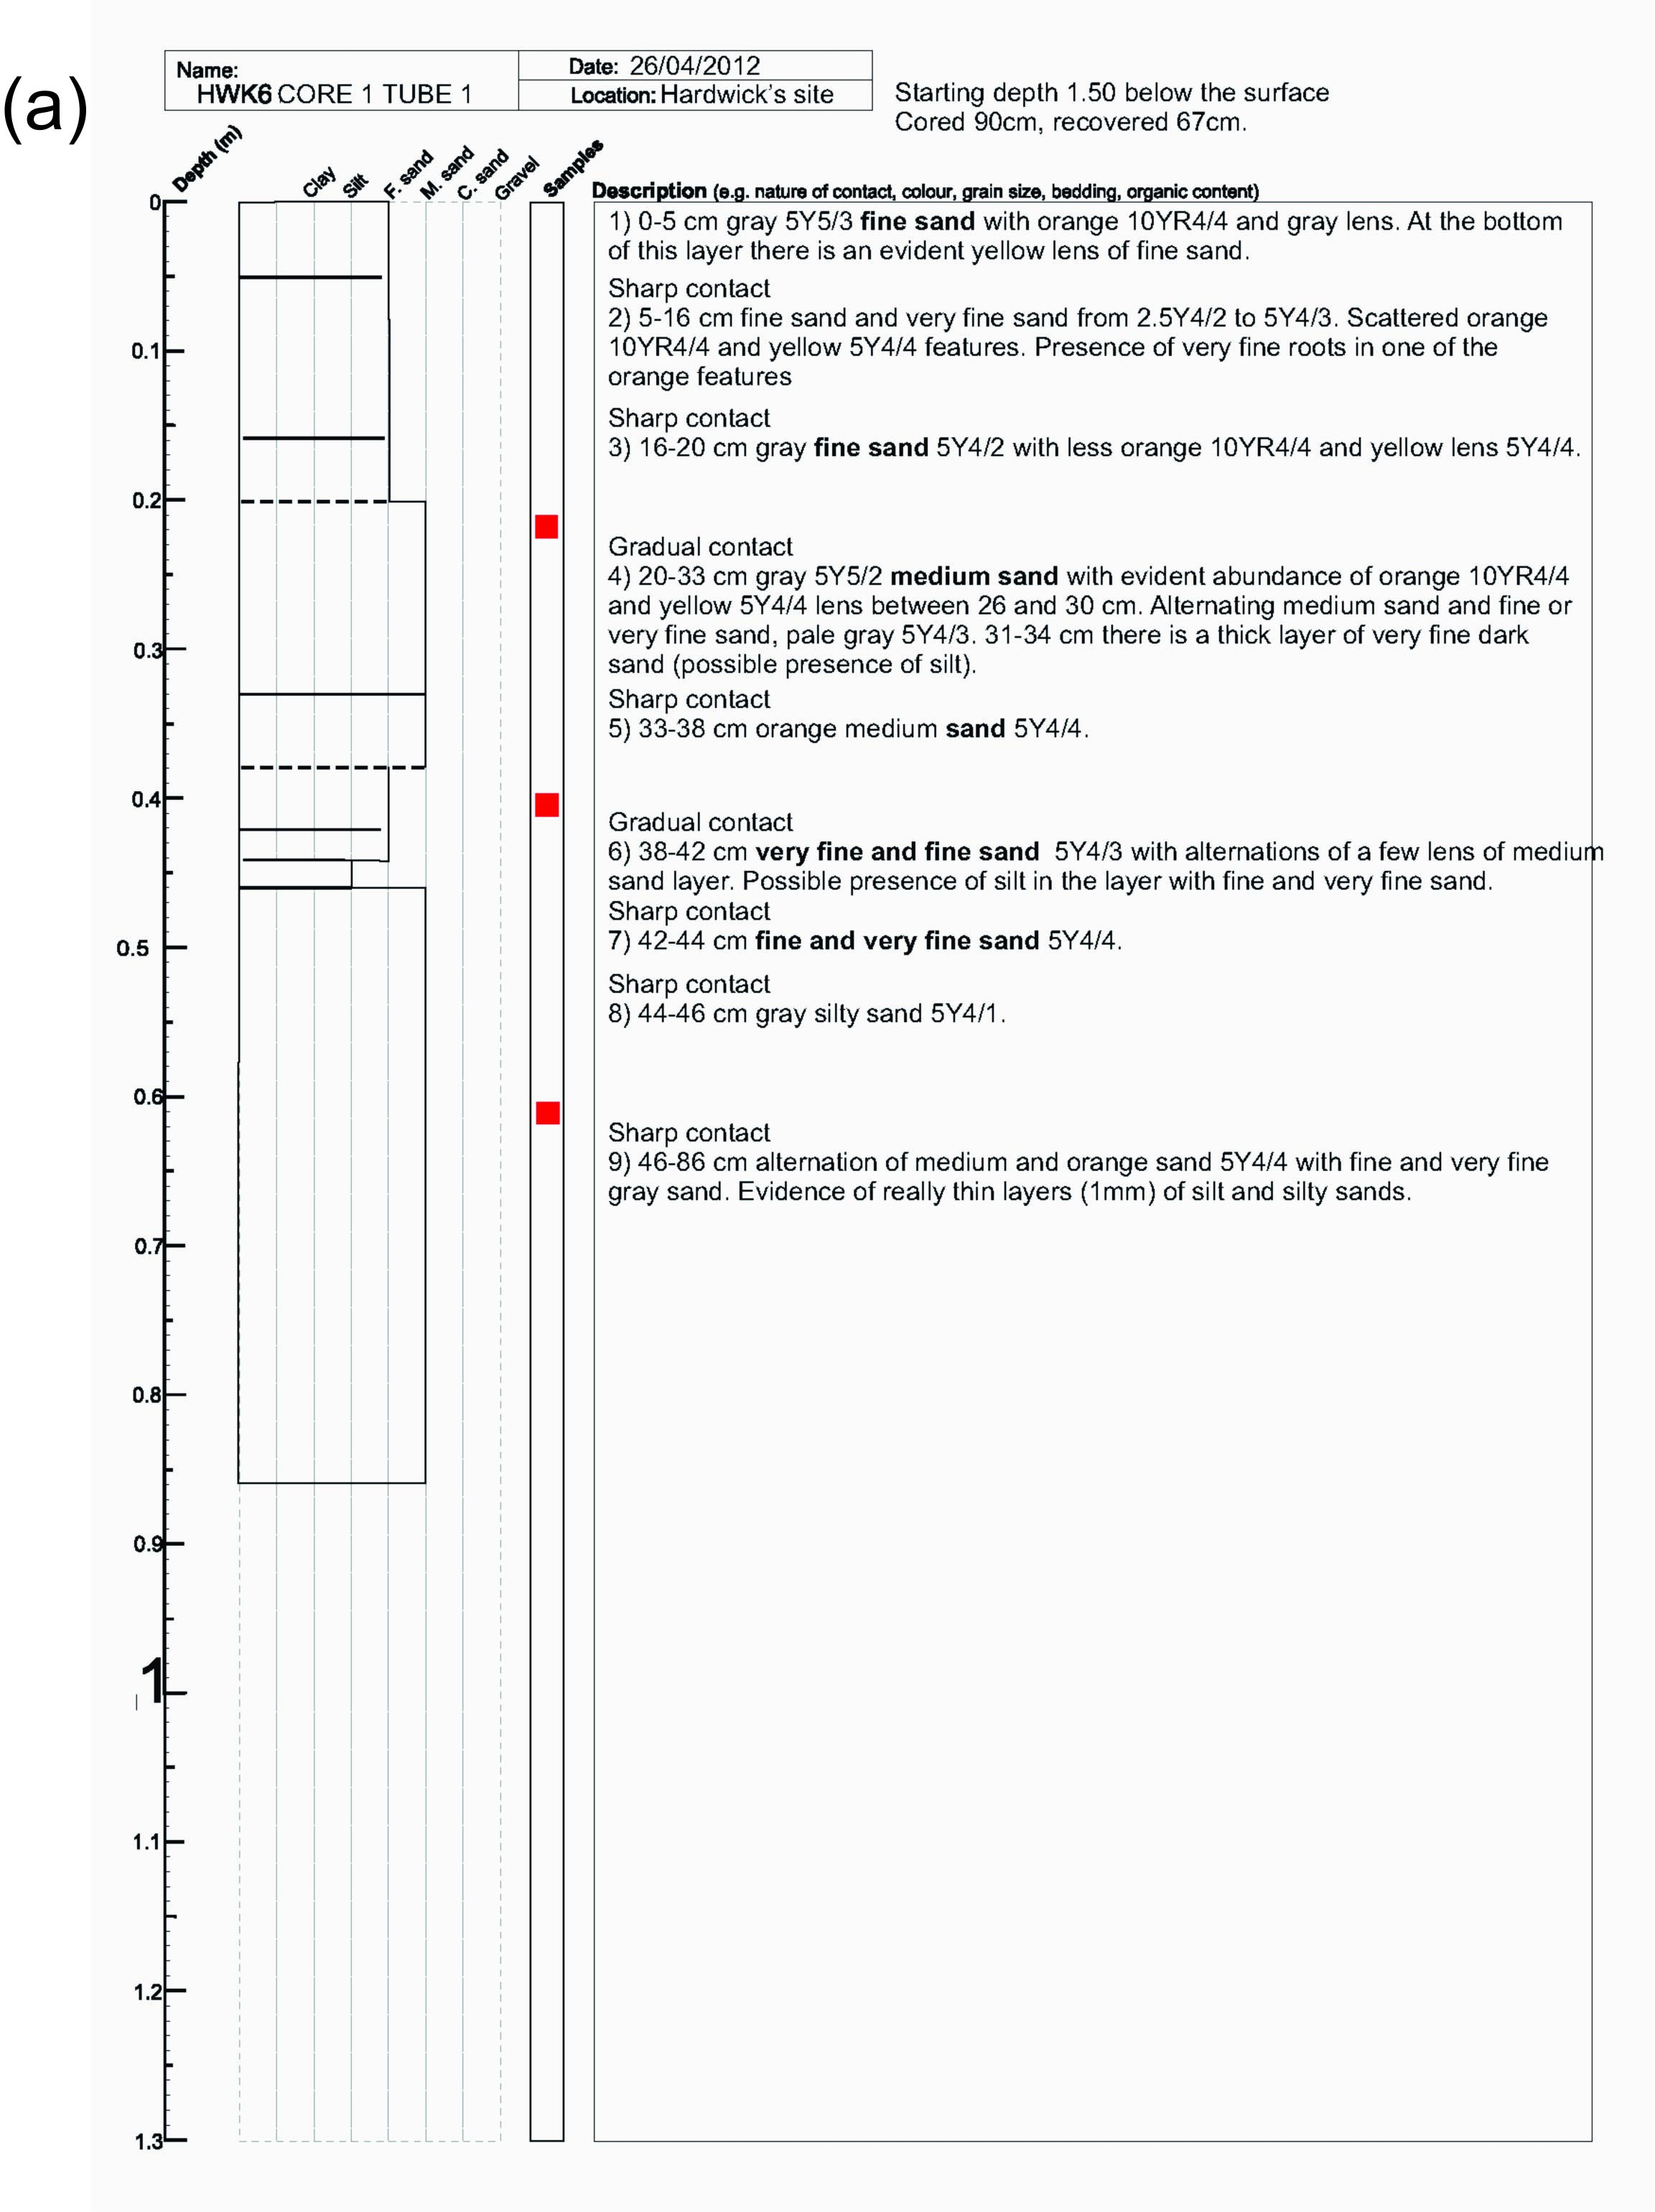
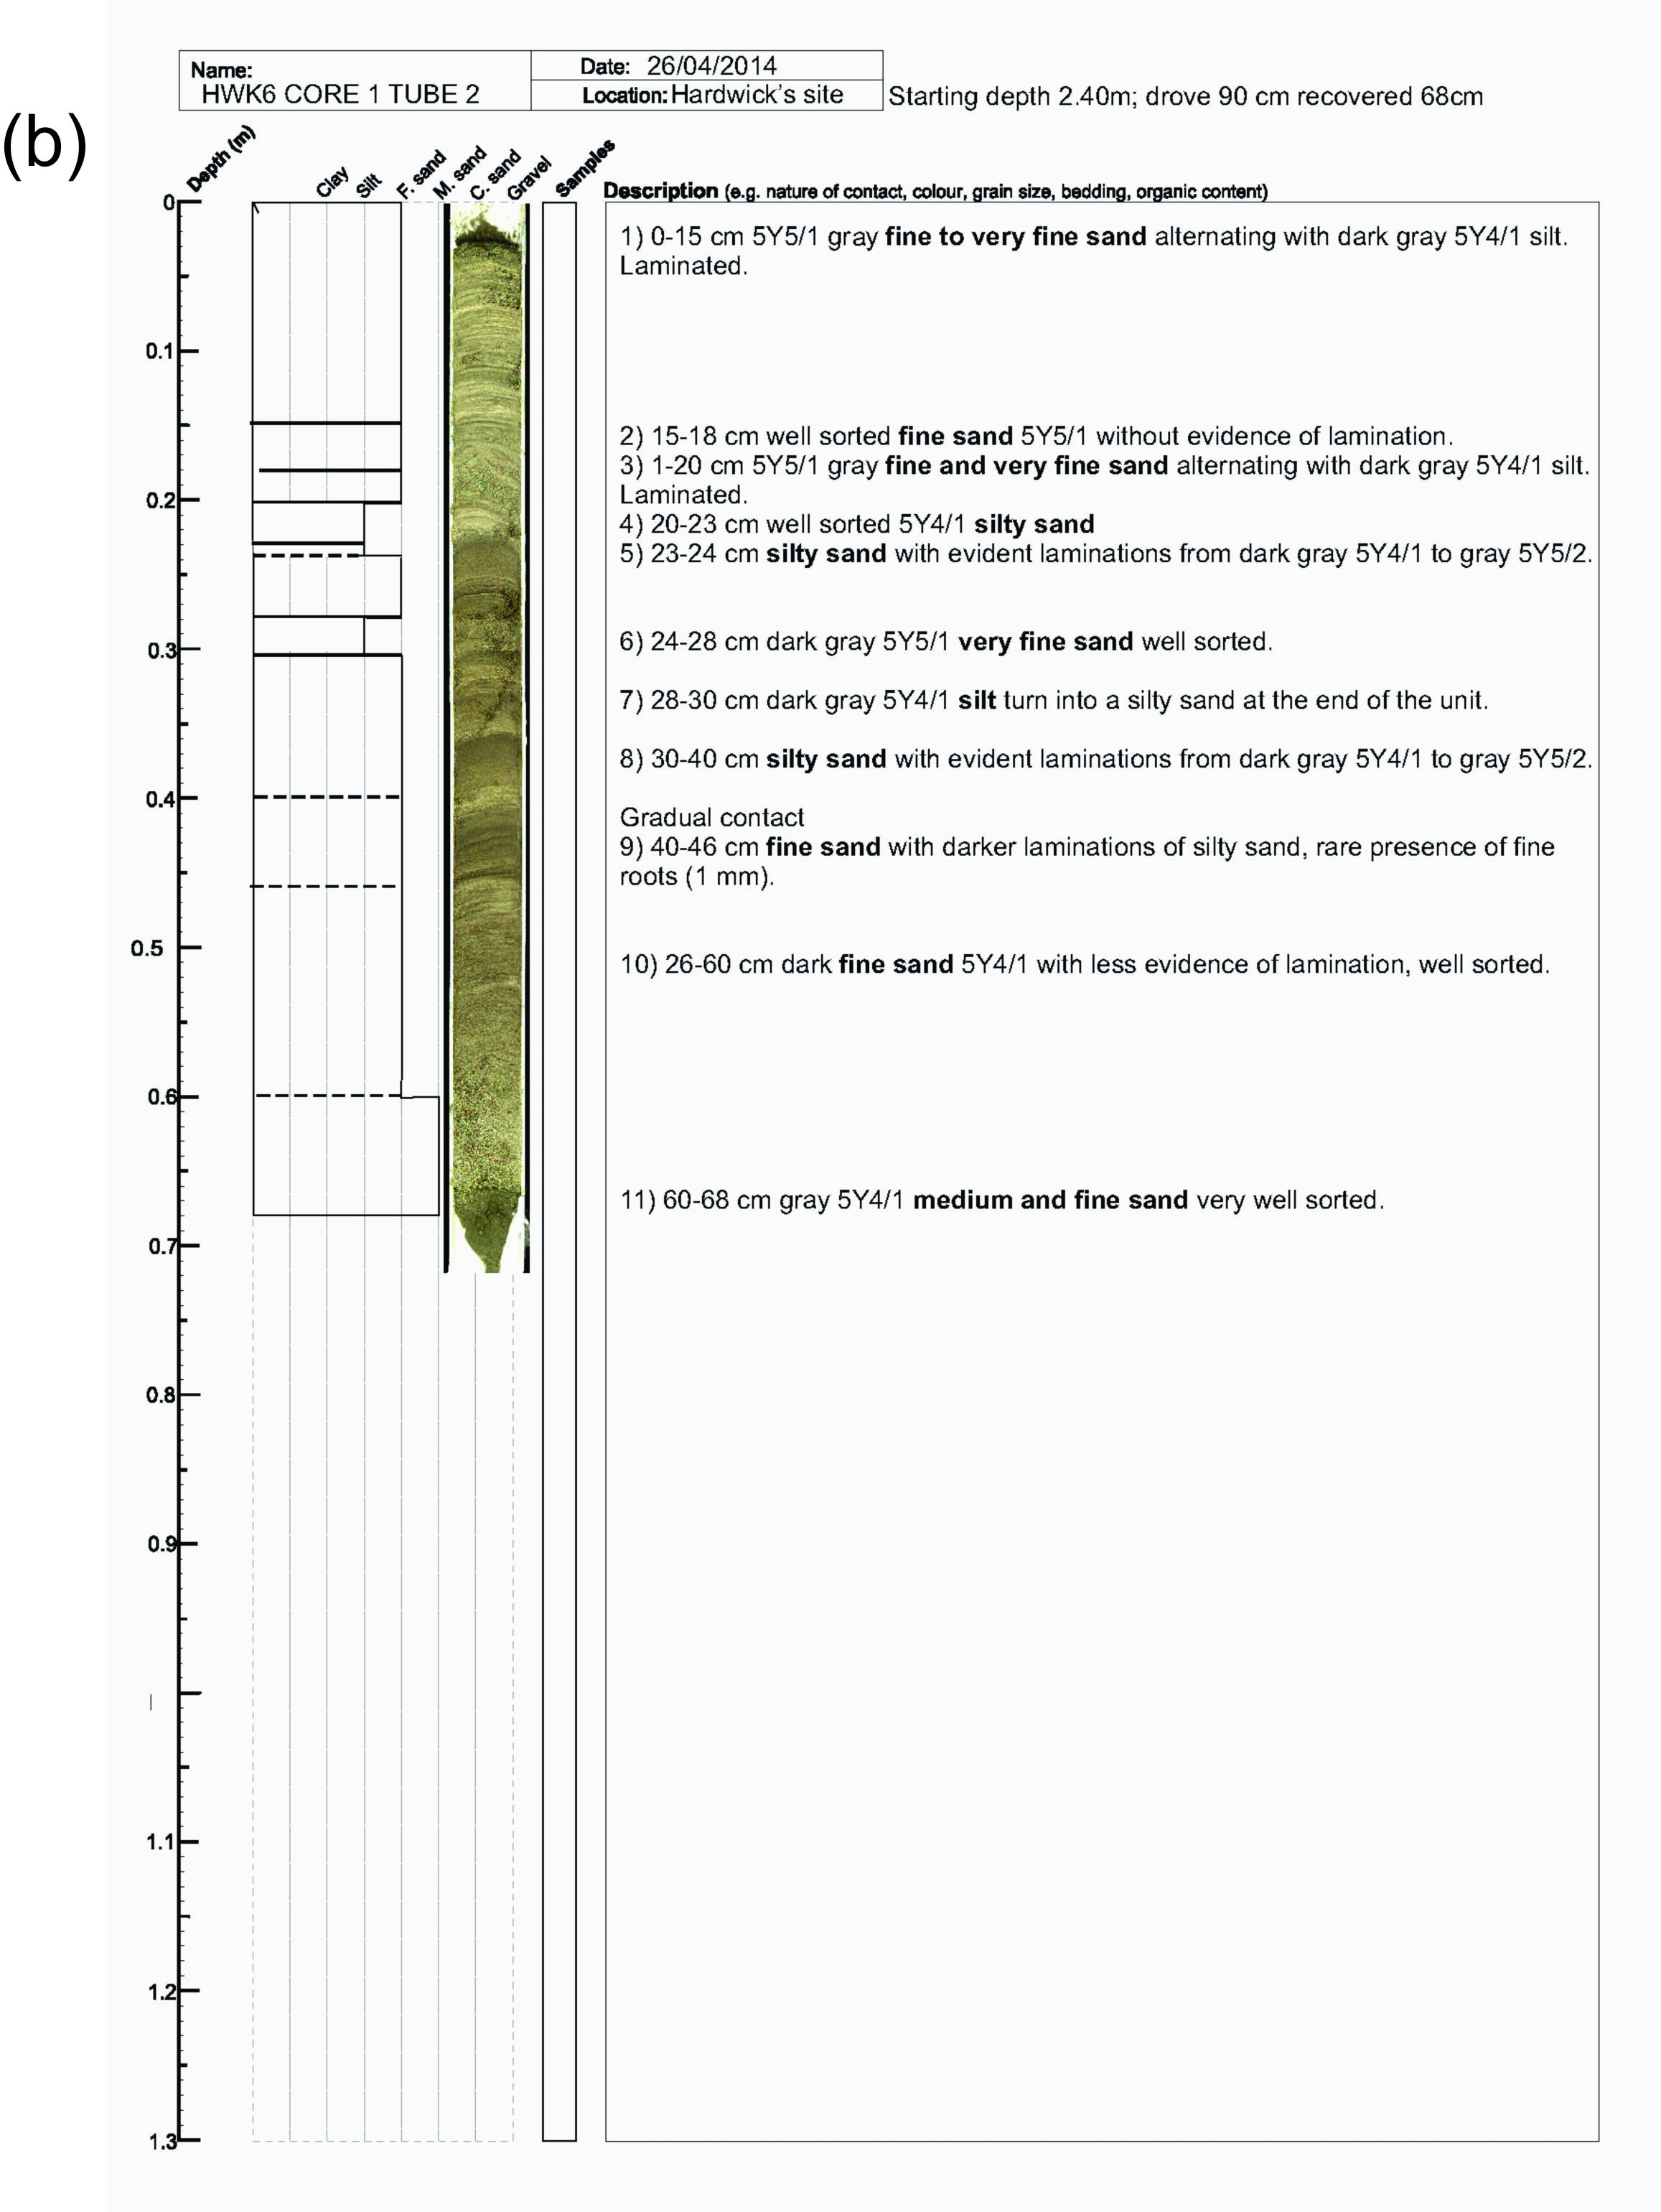
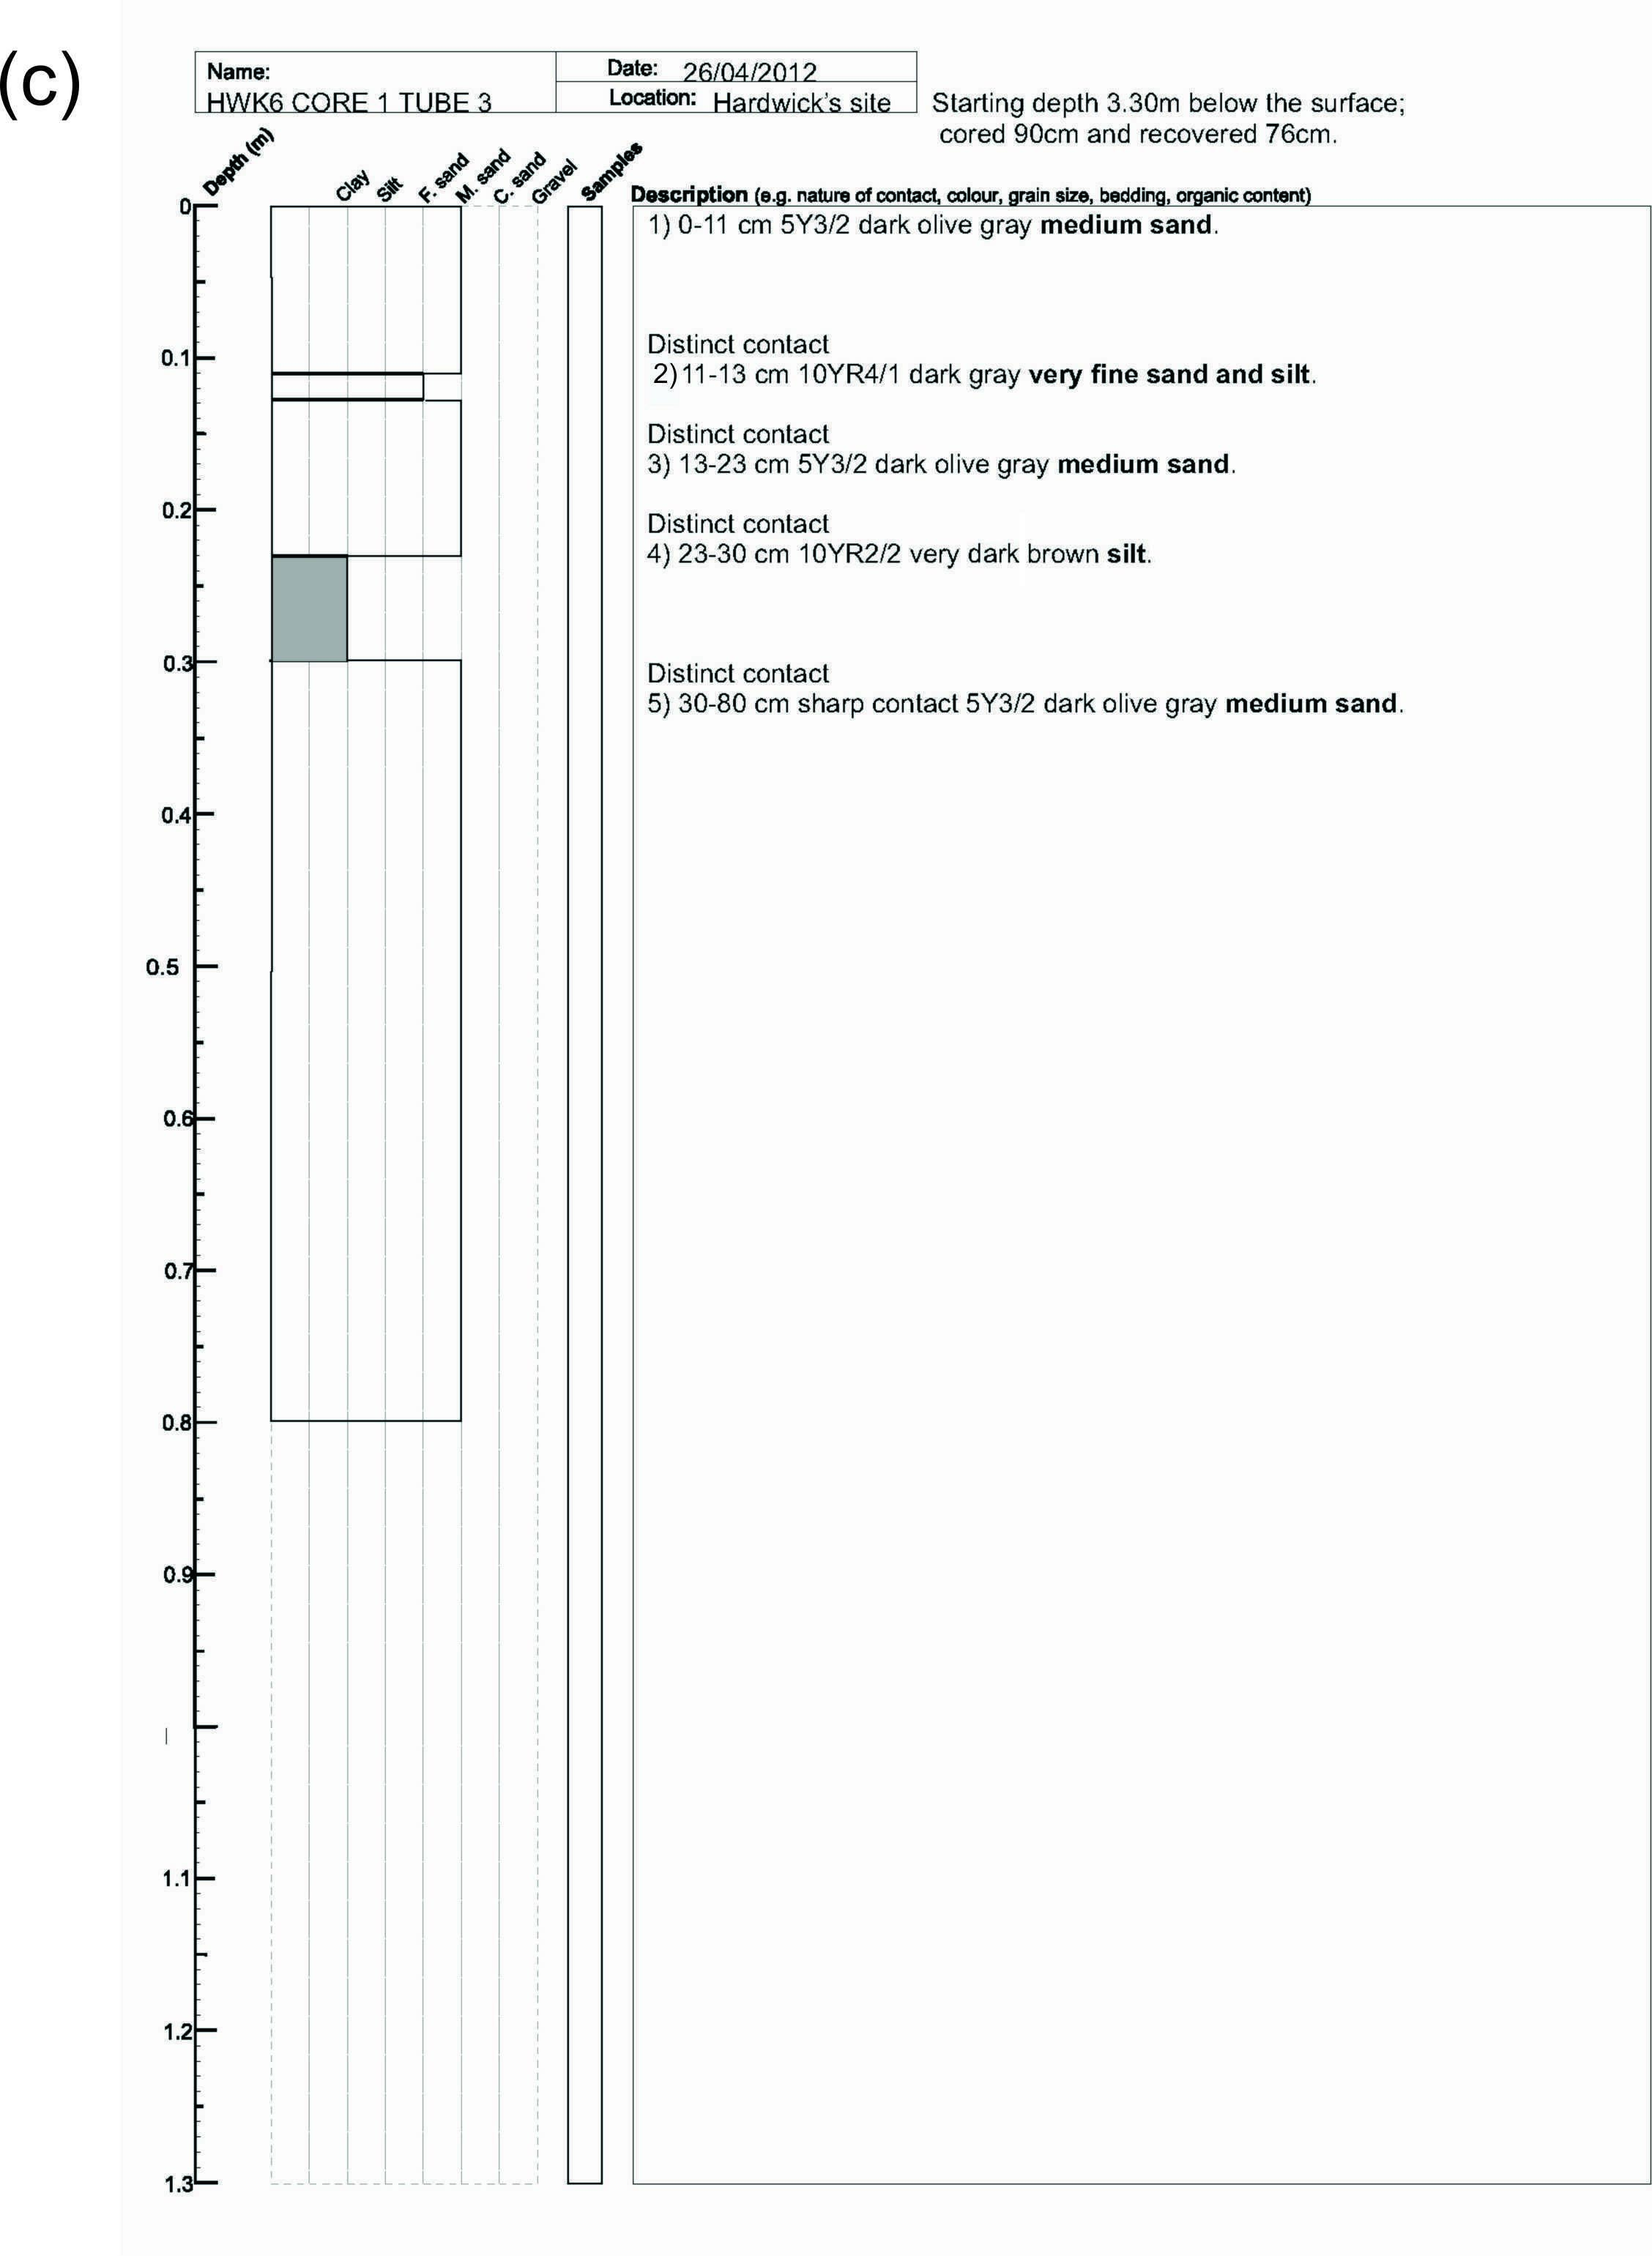
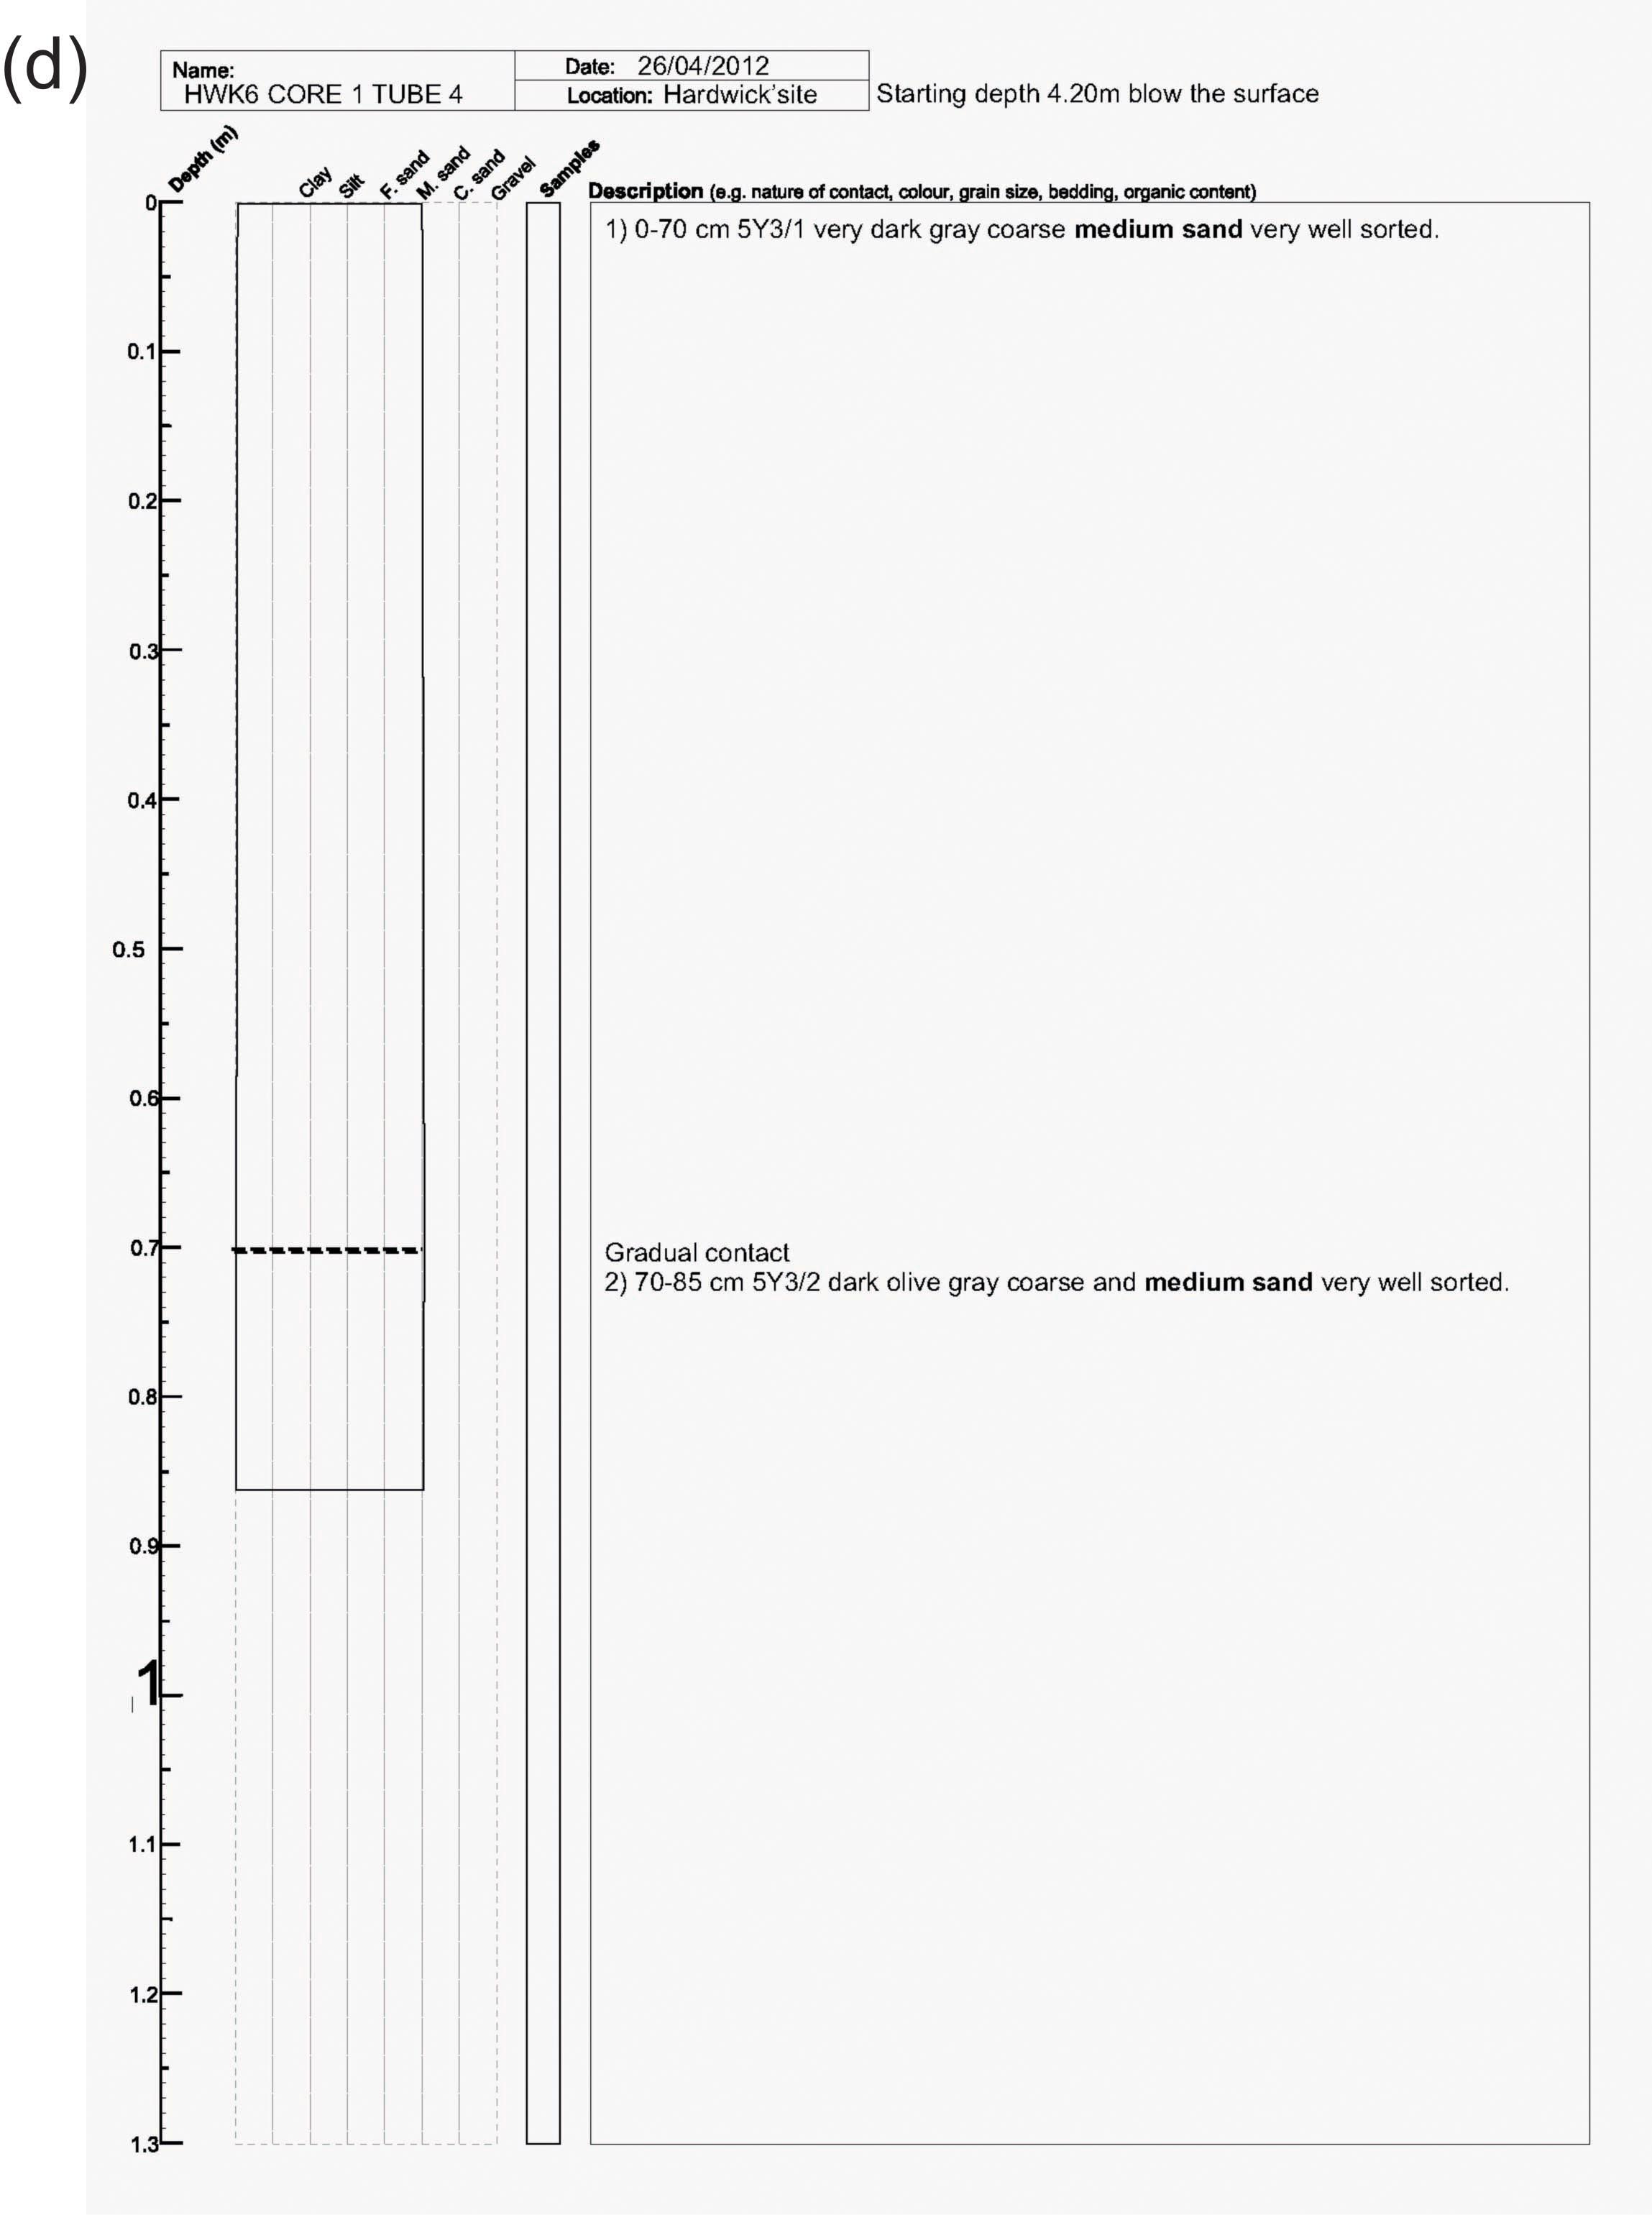
Figure S19. Log and unit descriptions of core HWK 6-1: (a) tube 1, (b) tube 2, (c) tube 3, and (d) tube 4.
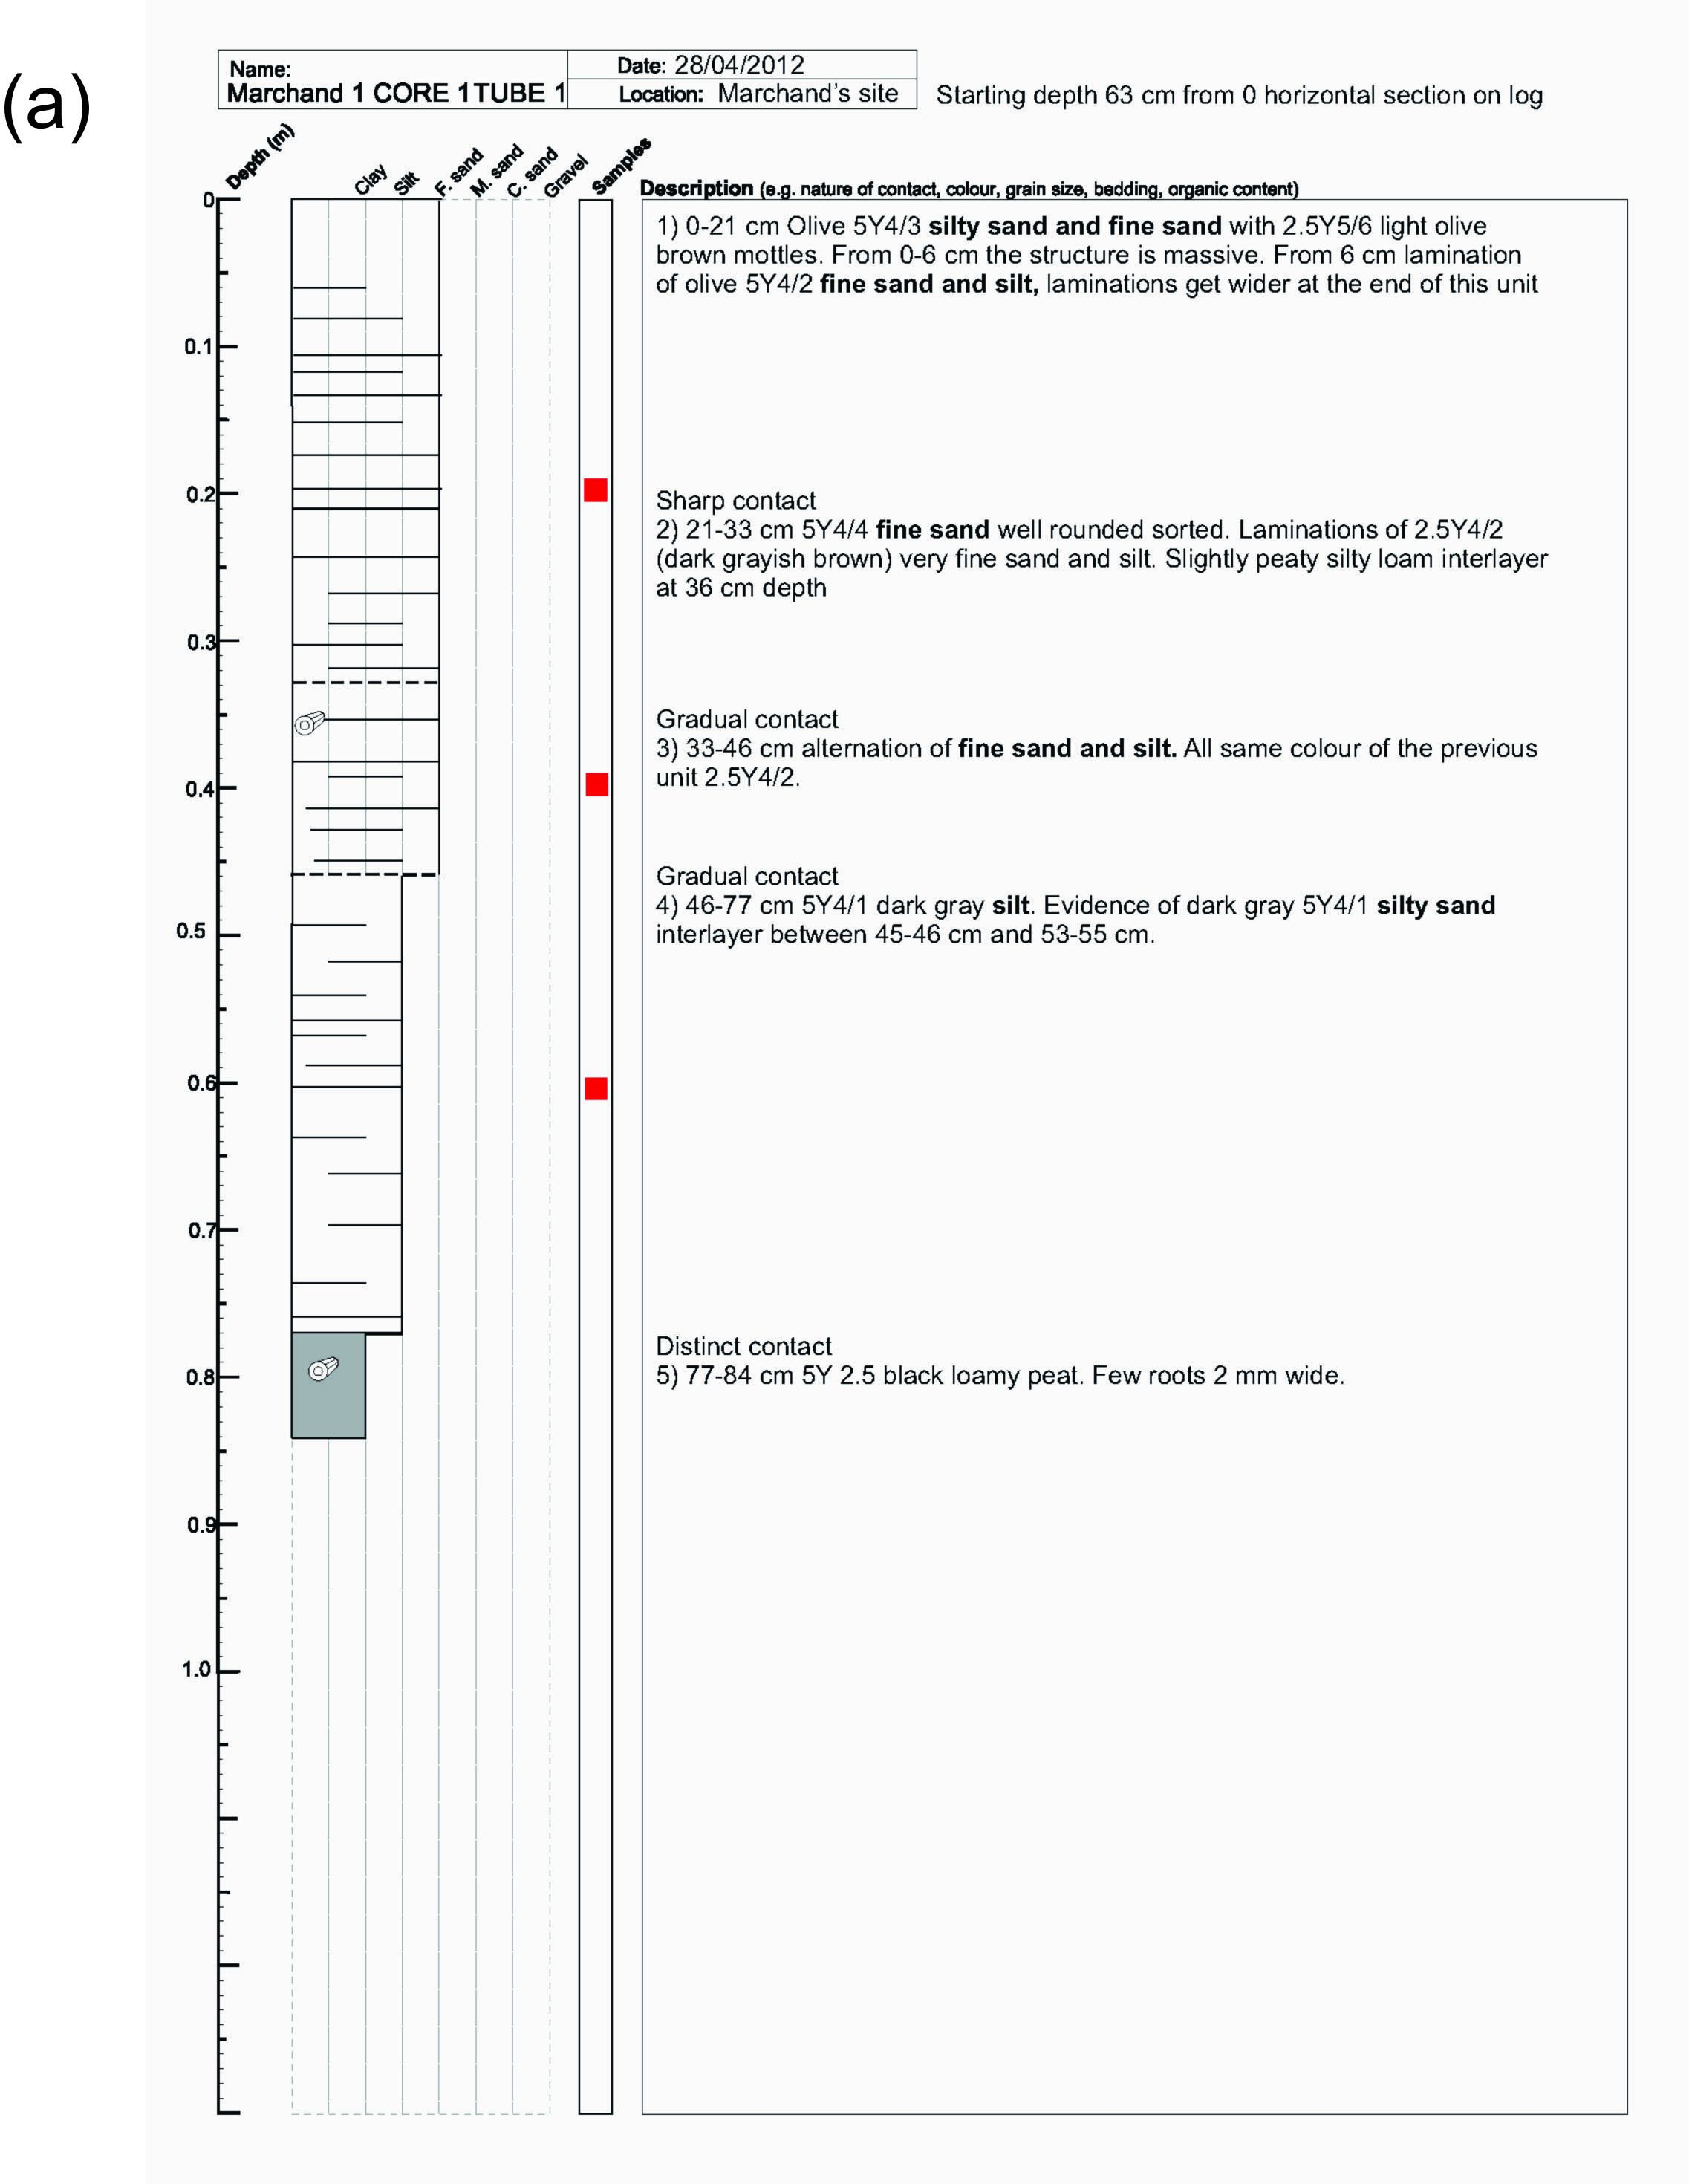
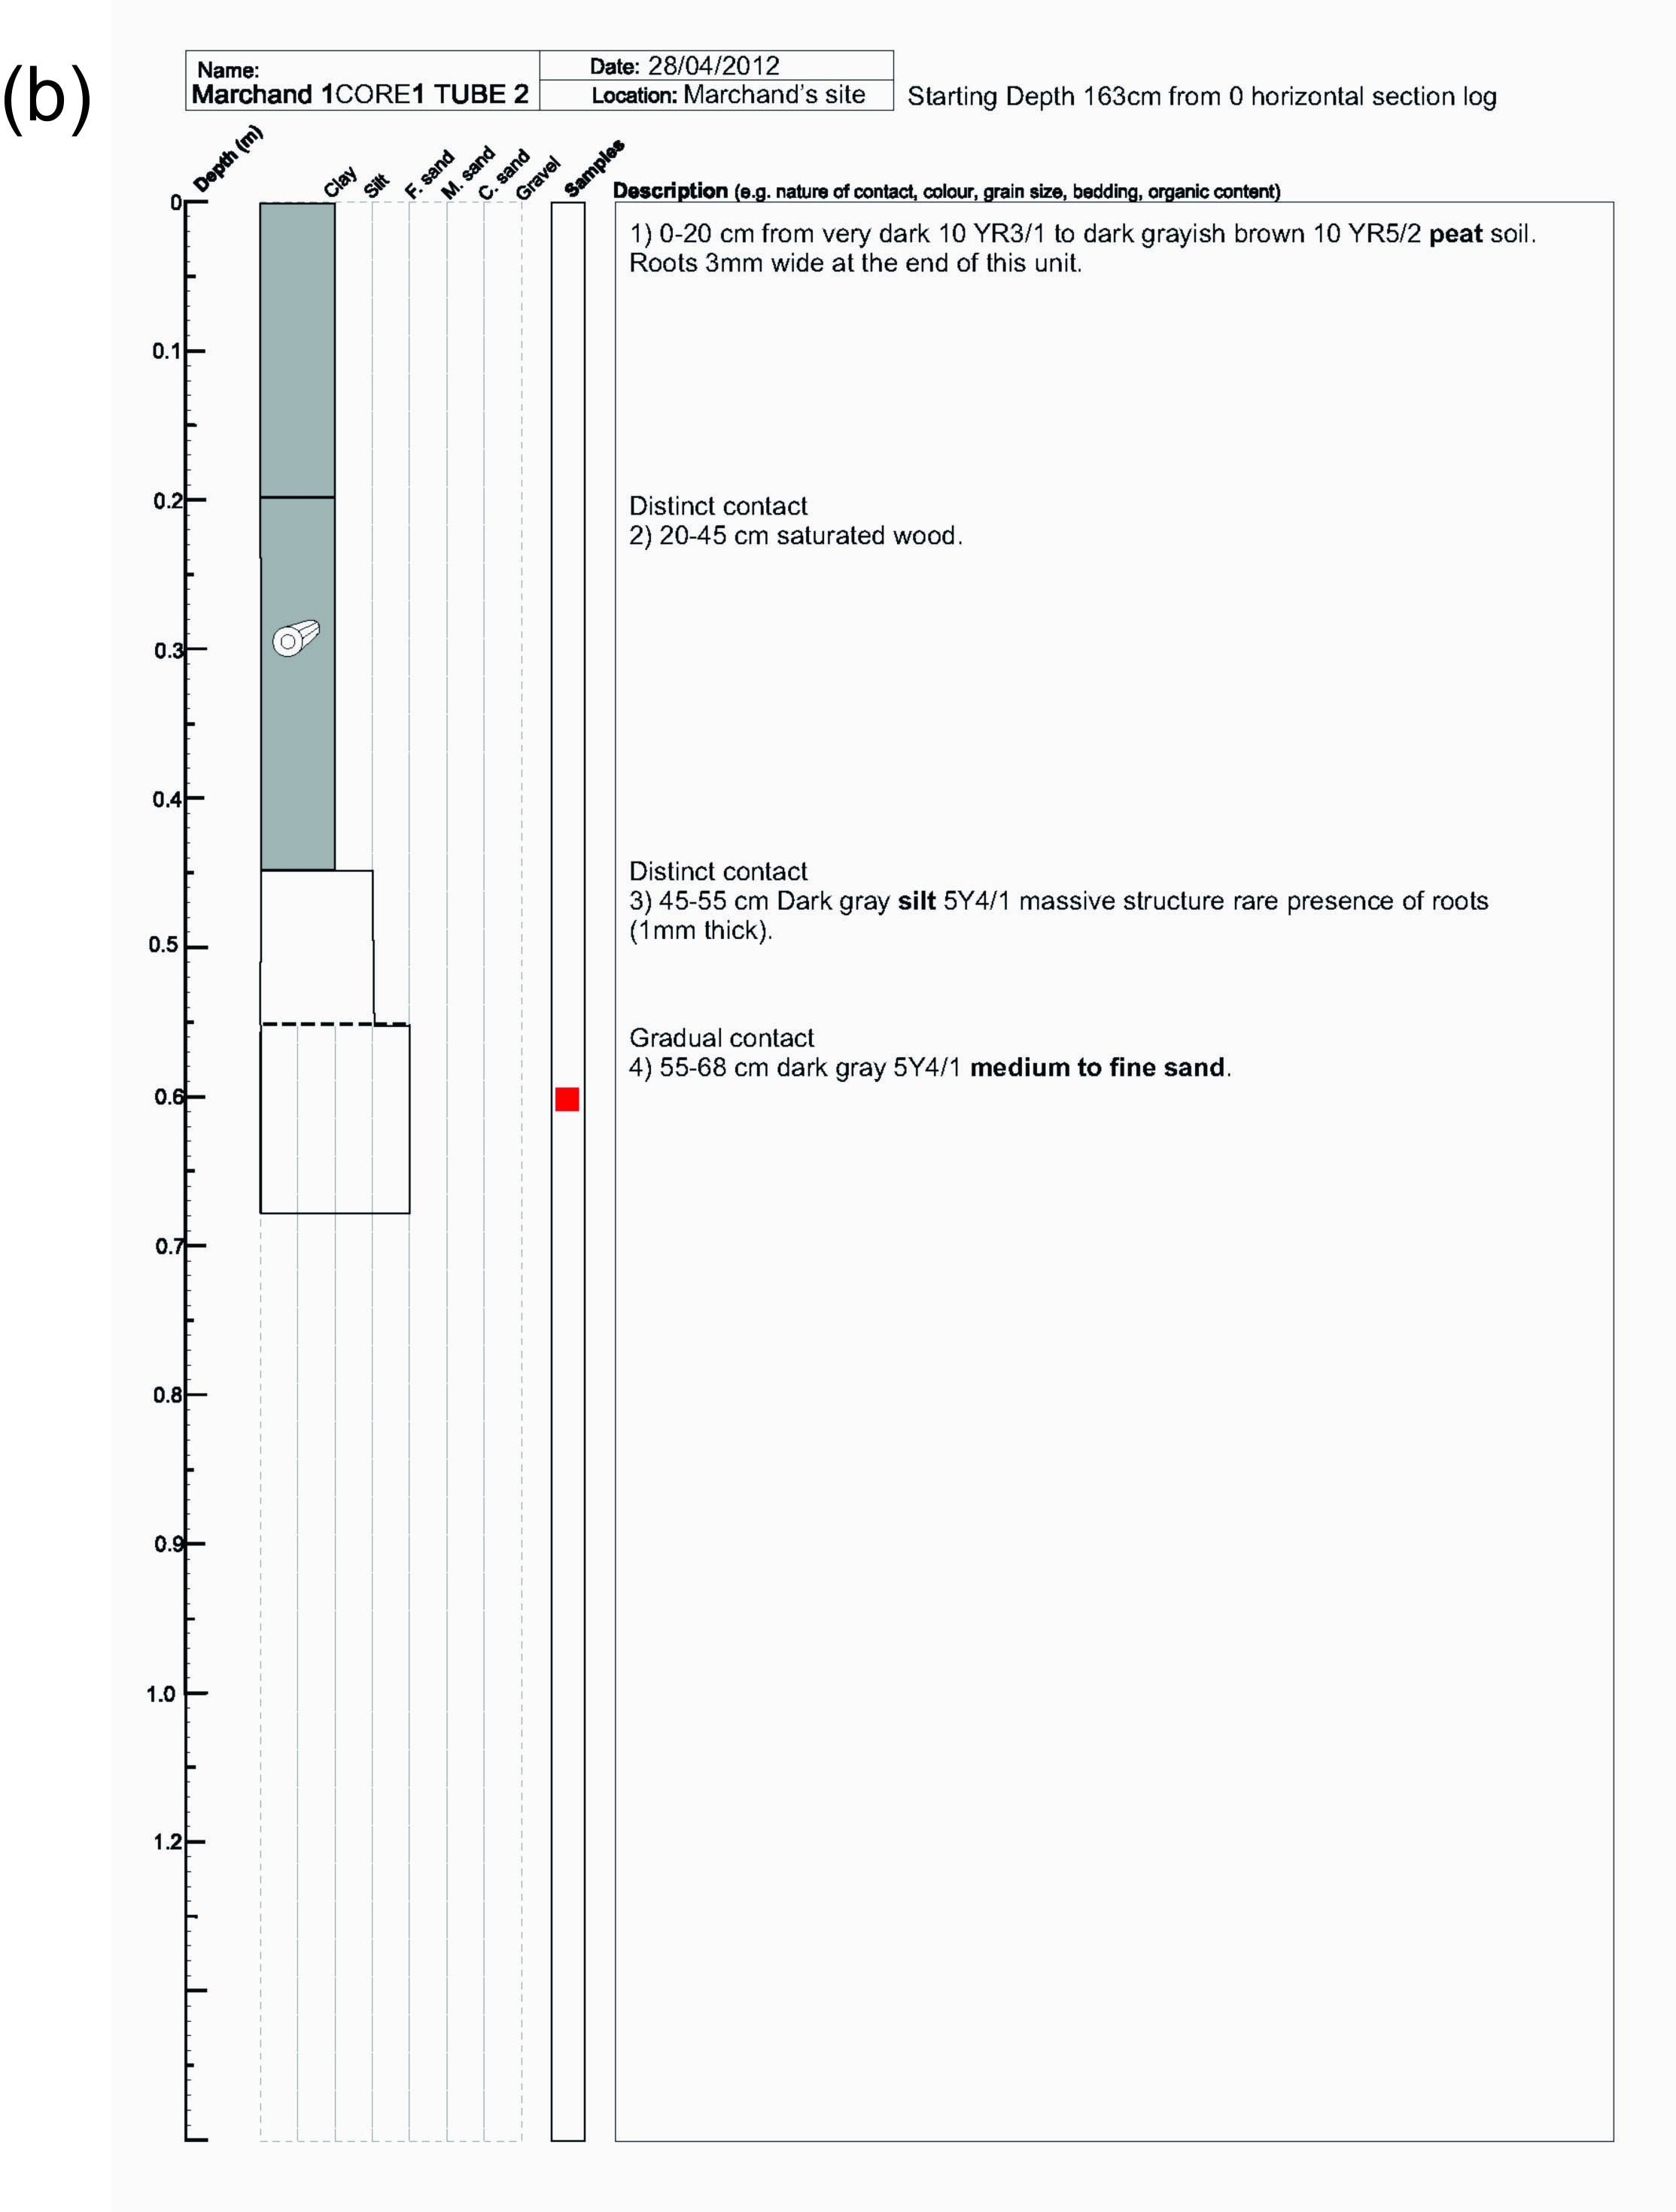
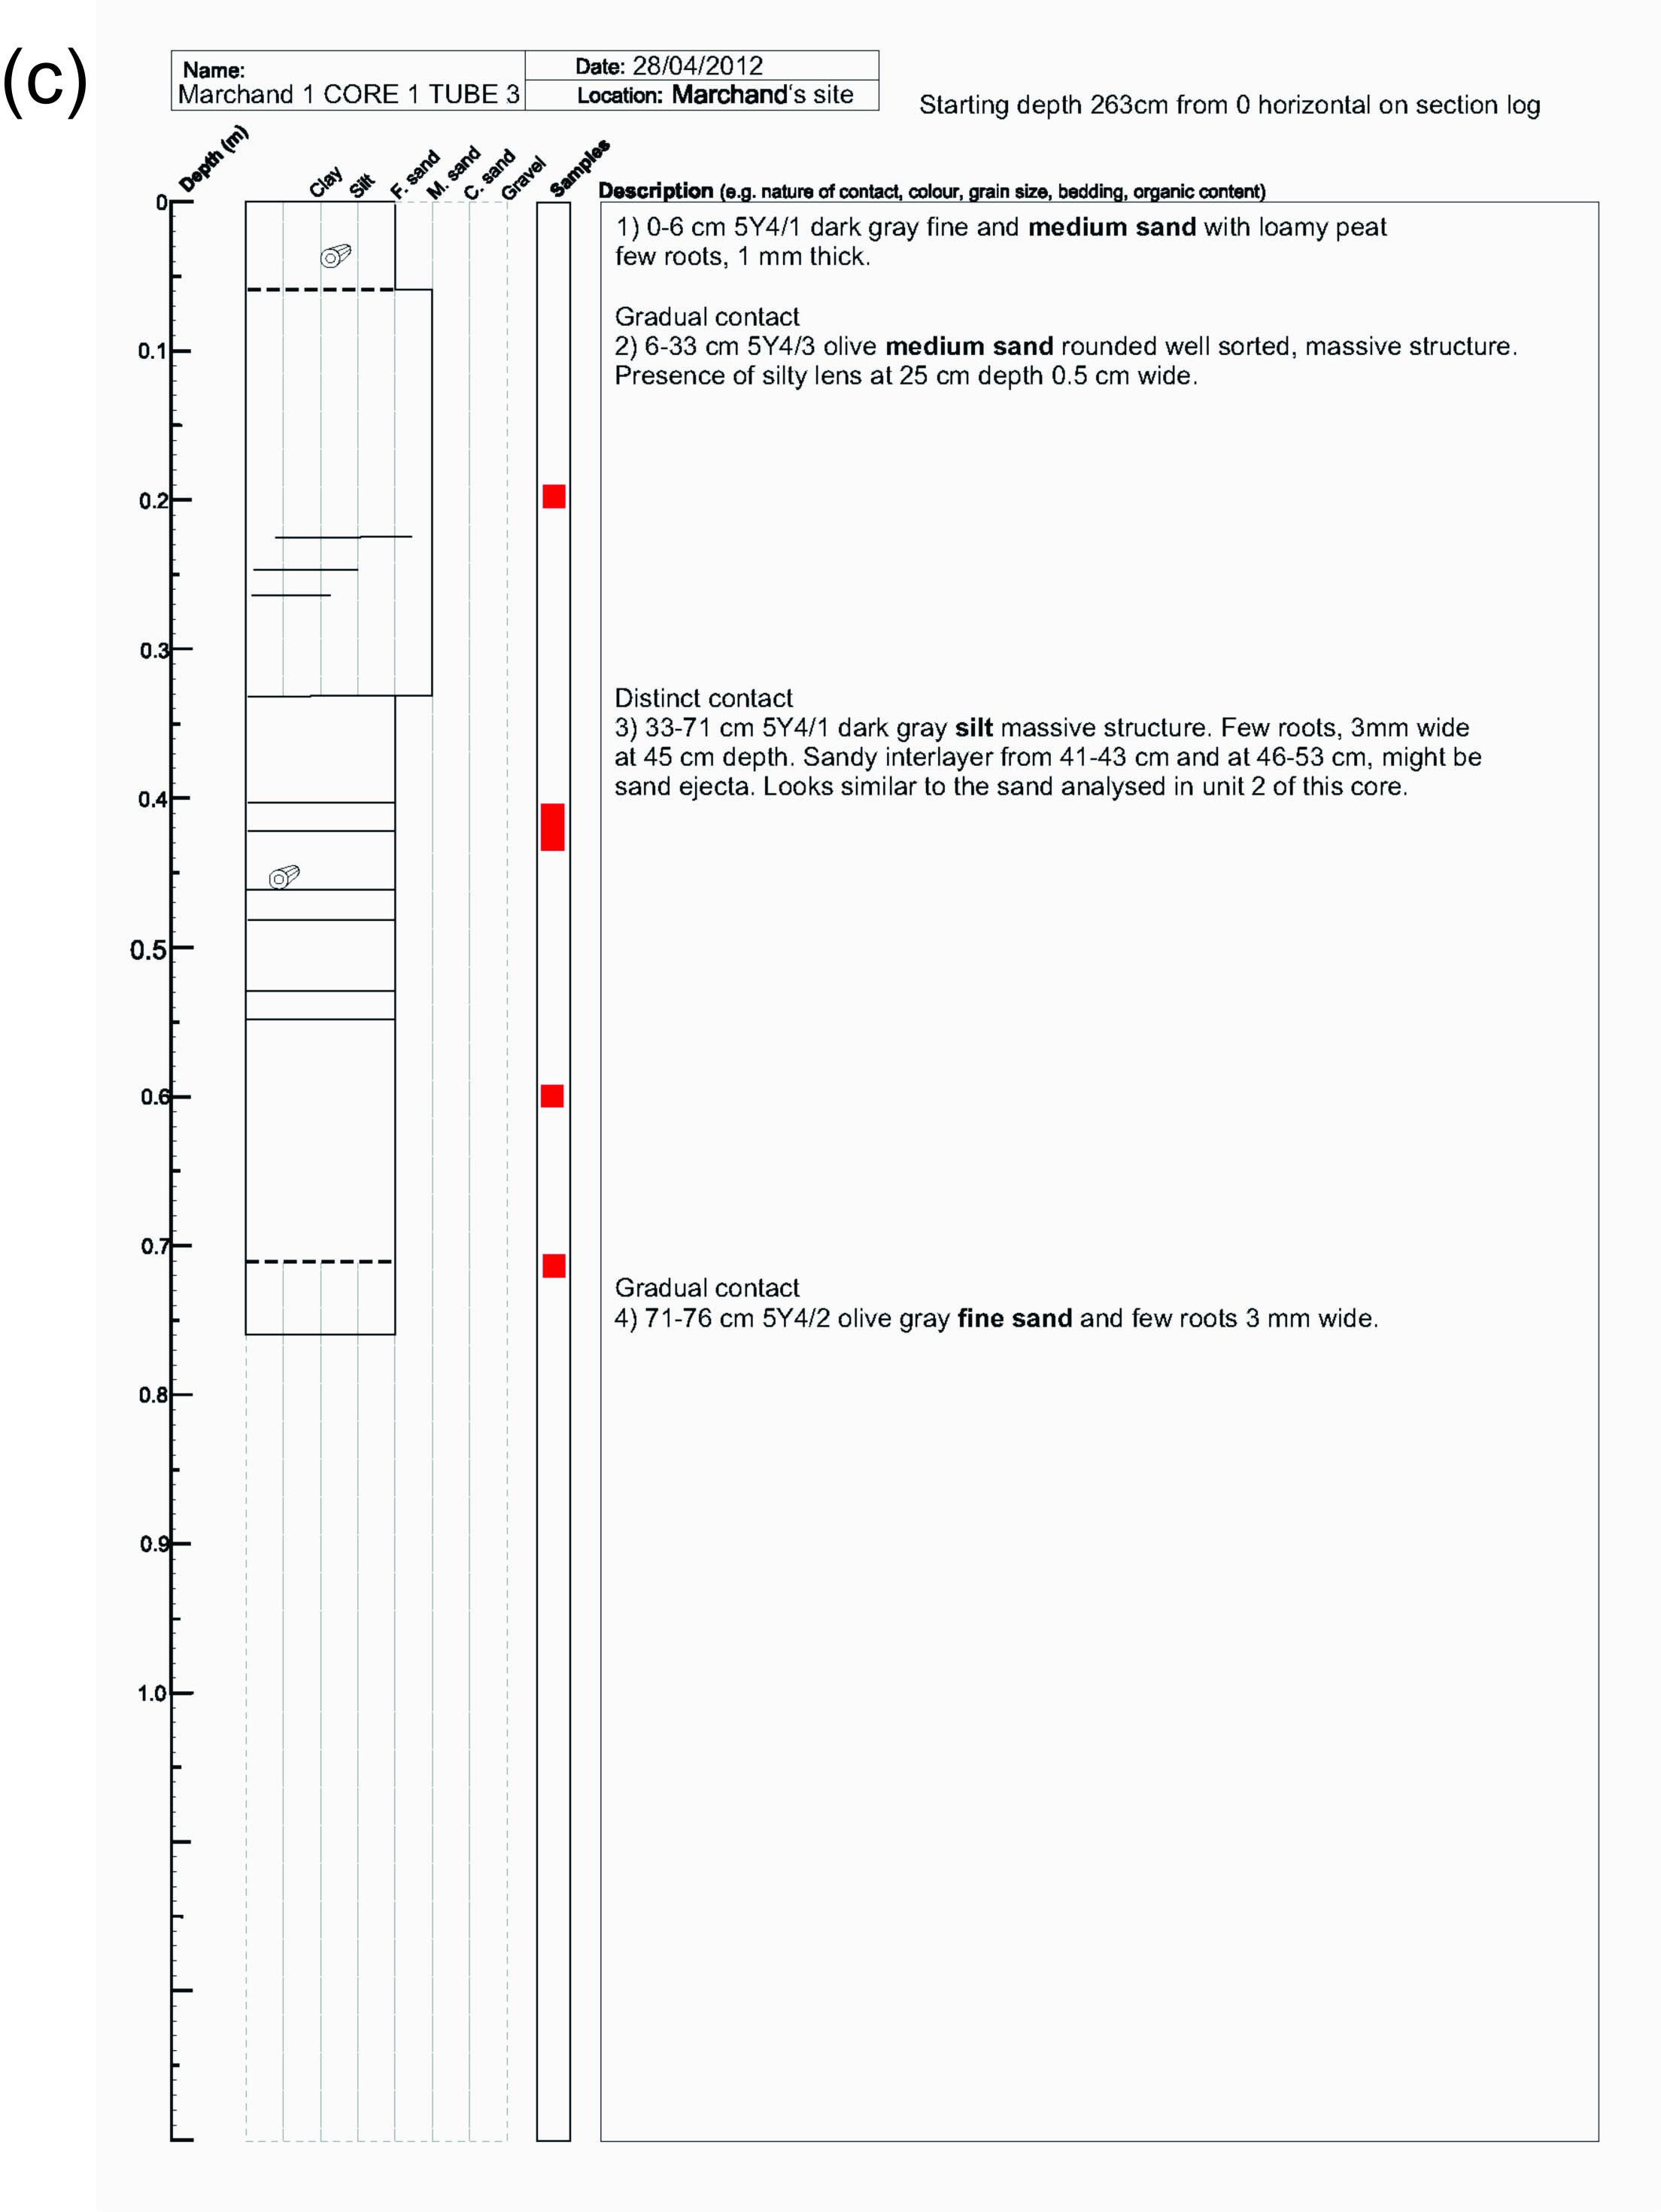
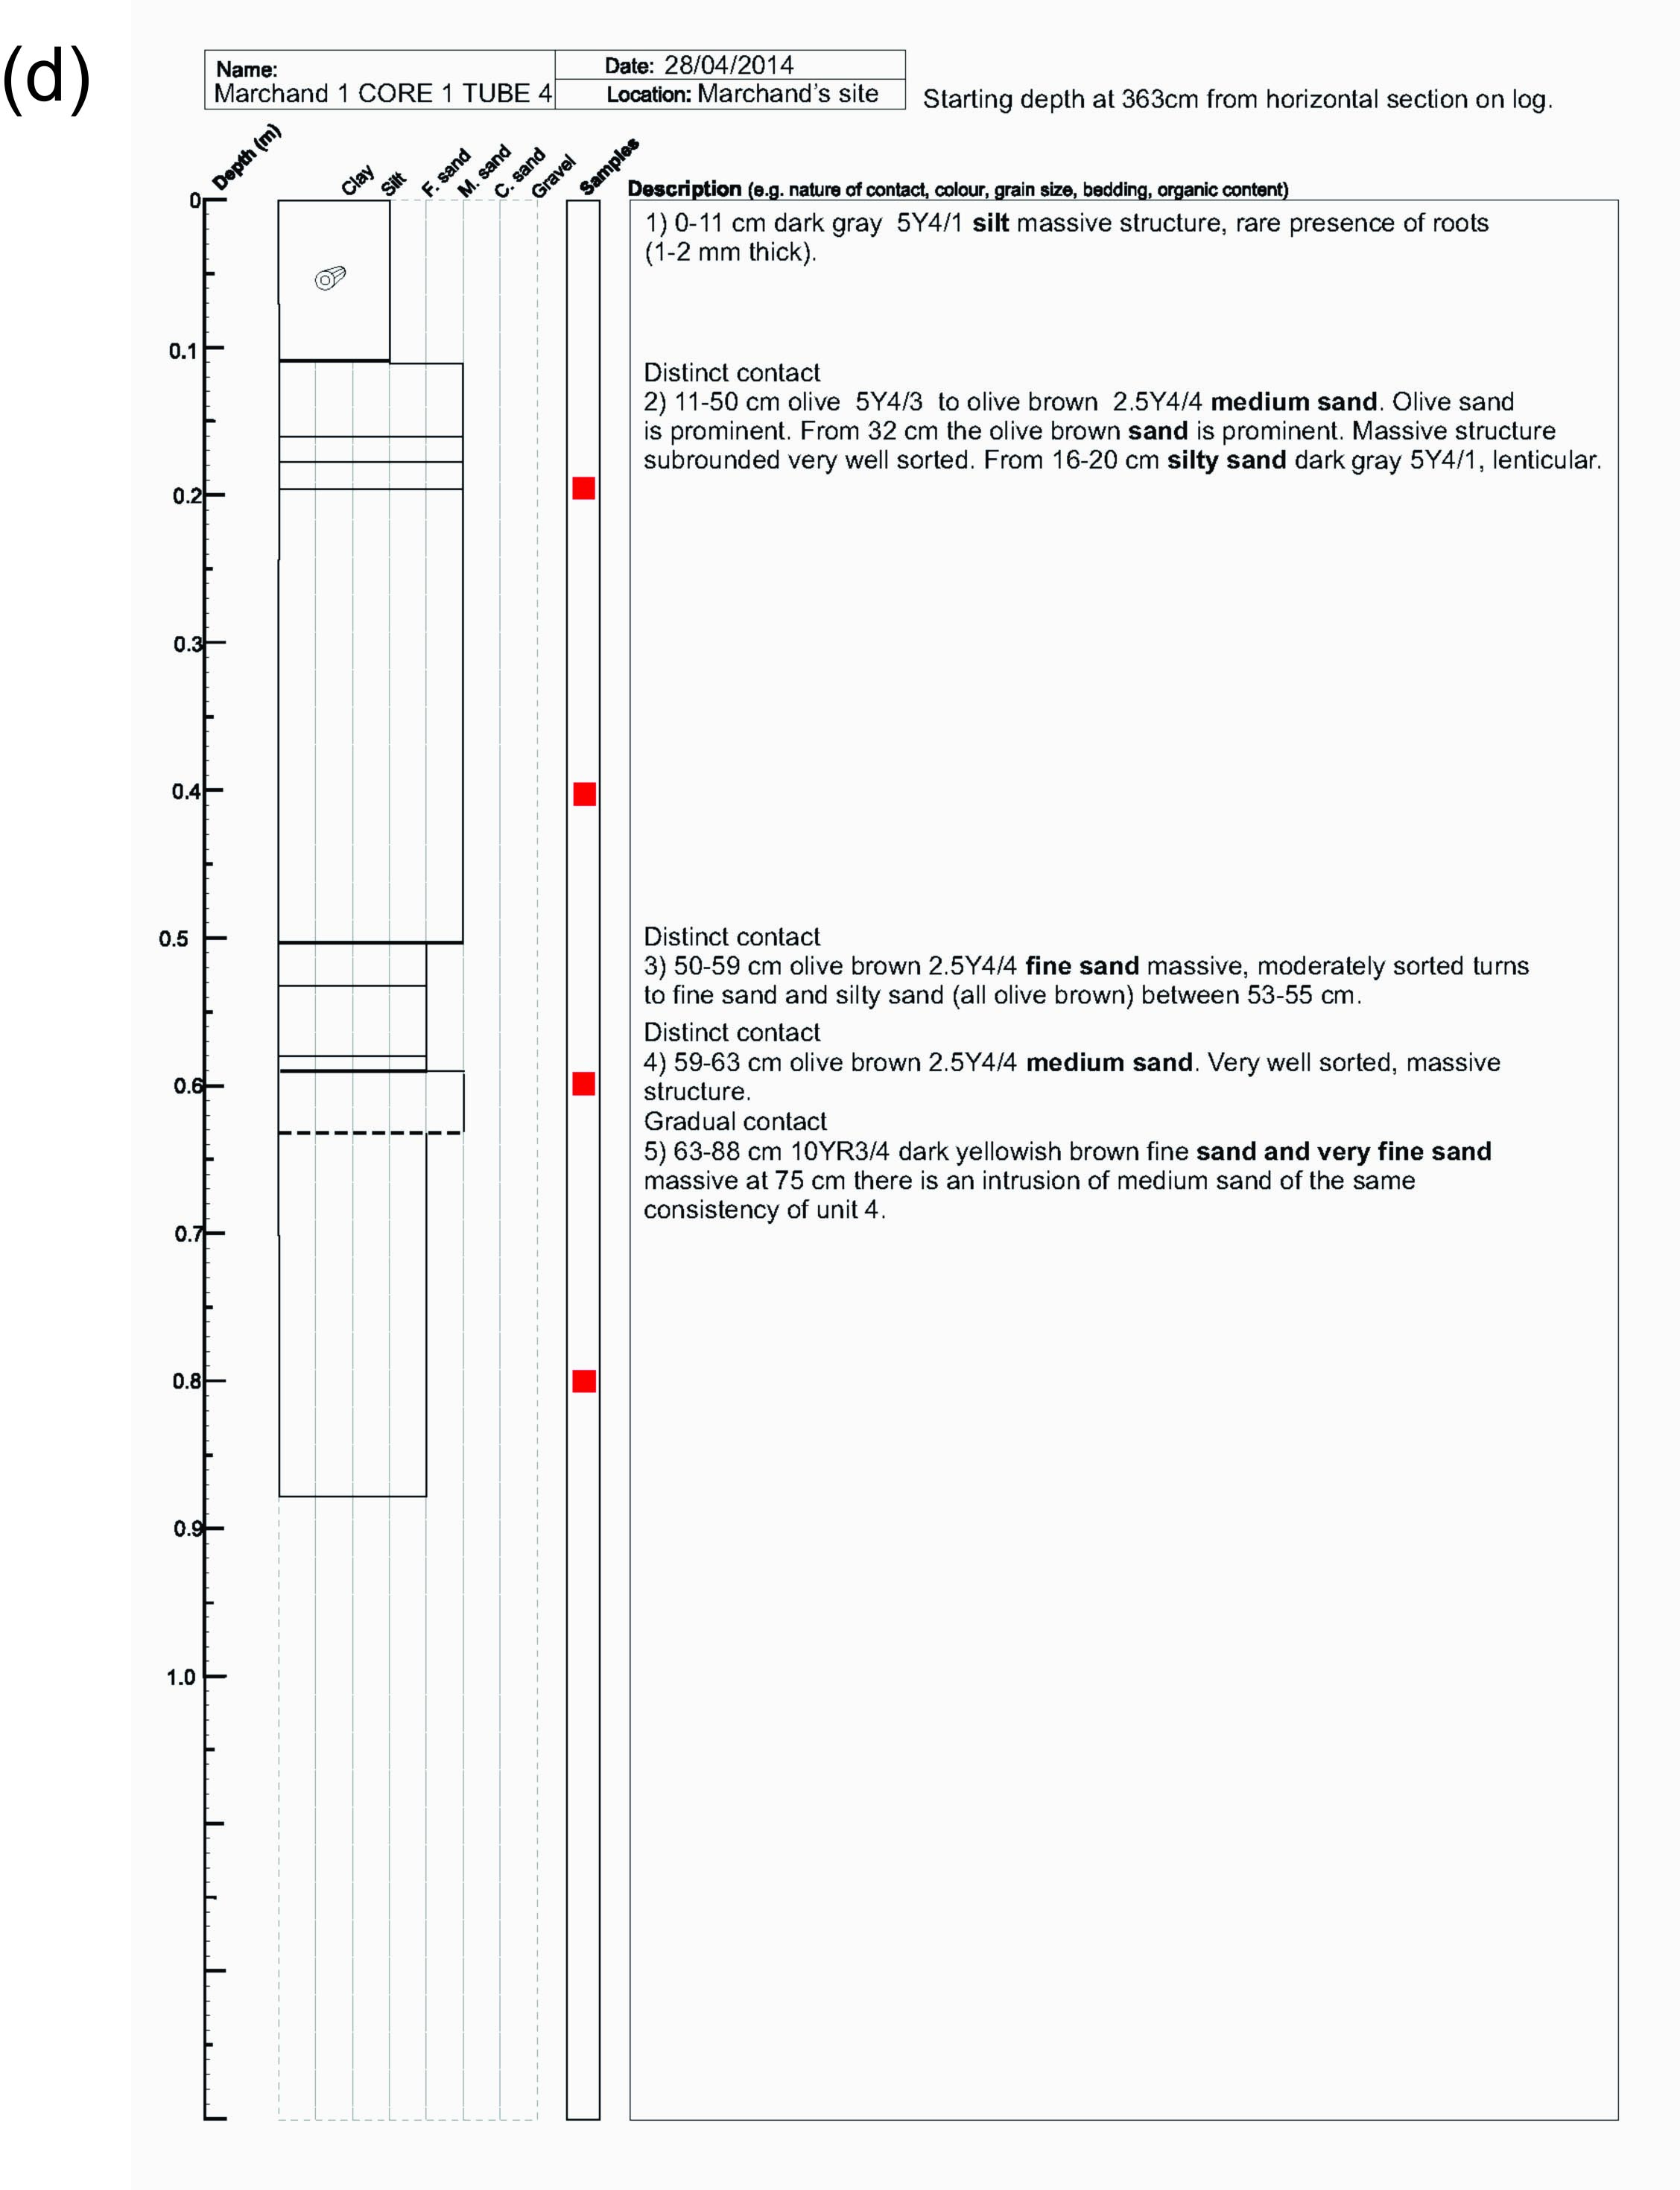
Figure S20. Log and unit descriptions of core MAR 1-1: (a) tube 1, (b) tube 2, (c) tube 3, and (d) tube 4.
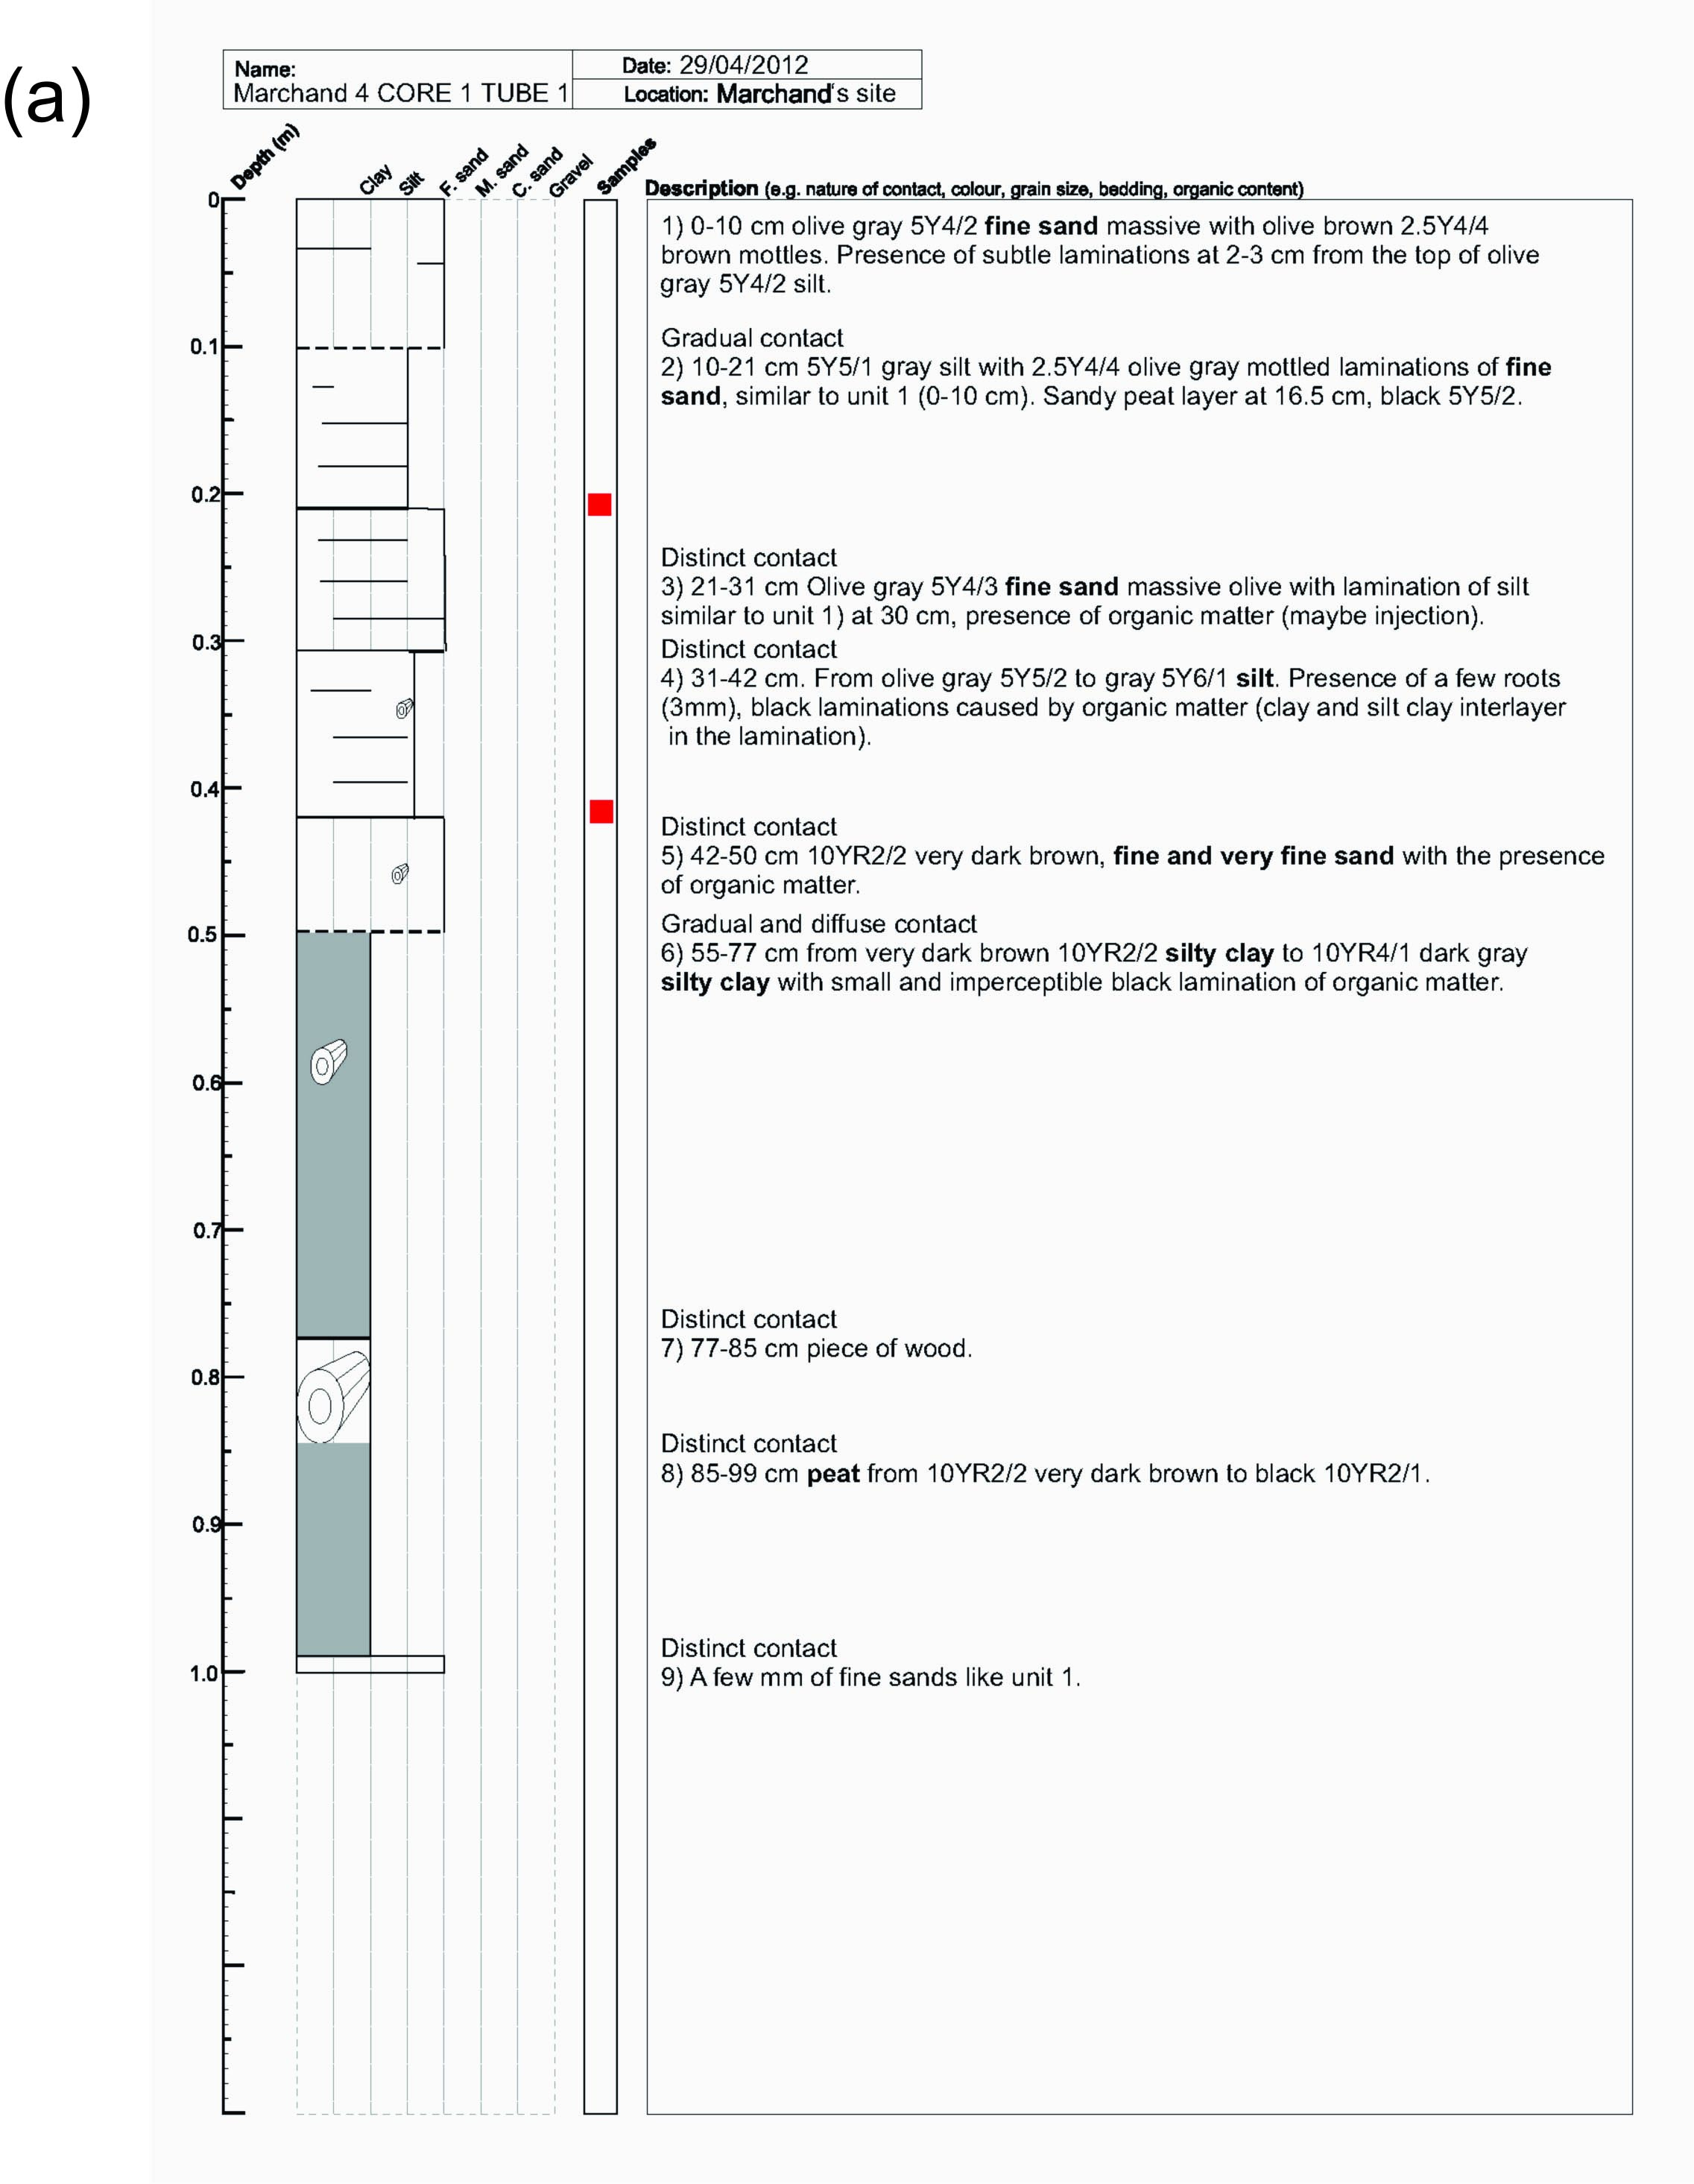
Figure S21. Log and unit descriptions of core MAR 4-1: (a) tube 1, (b) tube 2, and (c) tube 3.
Figure S22. OxCal analysis of Hardwick radiocarbon samples. Paleoliquefaction event occurred between A.D. 908 and A.D. 1336.
Figure S23. OxCal analysis of Marchand radiocarbon samples. Paleoliquefaction event occurred between A.D. 1017 and A.D. 1840.
Figure S24. OxCal analysis of the combined Hardwick and Marchand radiocarbon samples. Paleoliquefaction event occurred between A.D. 1019 and A.D. 1337.
Table S1. Hardwick site: HWK 1 trench unit descriptions. See Figure S3 for trench log.
Table S2. Hardwick site: HWK 2 trench unit descriptions. This trench was not logged.
Table S3. Hardwick site: HWK 3 trench unit descriptions. See Figures S4 and S5 for trench logs.
Table S4. Hardwick site: HWK 4a trench unit descriptions. This trench was not logged.
Table S5. Hardwick site: HWK 4b trench unit descriptions. See Figure S6 for trench log.
Table S6. Hardwick site: HWK 5 trench unit descriptions. See Figures S7 and S8 for trench logs.
Table S7. Hardwick site: HWK 6 trench unit descriptions. See Figures S9 and S10 for trench logs.
Table S8. Marchand site: MAR 1 trench unit descriptions. See Figures S11 and S12 for trench logs.
Table S9. Marchand site: MAR 3 trench unit descriptions. See Figure S13 for trench log.
Table S10. Marchand site: MAR 4 trench unit descriptions. See Figure S14 for trench log.
Table S11. Sand-blow and dike-size data.
Table S12. Dike strikes measured in trenches.
Table S13. Radiocarbon dates.
Figure S1 resources include modern orthophotos from Land Information New Zealand (http://www.linz.govt.nz/land/maps/aerial-imagery-and-orthography, last accessed January 2014), Landcare Research, Google Earth (https://www.google.com/earth, last accessed January 2014), and a DEM from lidar survey from the Canterbury Geotechnical Database (https://www.nzgd.org.nz/, last accessed January 2013).
Brackley, H. (compiler) (2012). Review of liquefaction hazard information in eastern Canterbury, including Christchurch City and parts of Selwyn, Waimakariri and Hurunui Districts, 2012 ECA Report, R12/83, 99 pp.
Bronk Ramsey, C. (2009). Bayesian analysis of radiocarbon dates, Radiocarbon 51, no. 1, 337–360.
Hogg, A. G., Q. Hua, P. G. Blackwell, M. Niu, C. E. Buck, T. P. Guilderson, T. J. Heaton, J. G. Palmer, P. J. Reimer, R. W. Reimer, et al. (2013). SHCal13 southern hemisphere calibration, 0–50,000 cal yr BP, Radiocarbon 55, no. 4, doi: 10.2458/azu_js_rc.55.16783.
Palmer, N. G. (2011). LIDAR check site survey report post Canterbury aftershock of 13 June 2011, GNS Science Consultancy Rept. 2011/260, 13 pp.
[ Back ]