This supplement lists the M ≥ 6.4 earthquakes from the Uniform California Earthquake Rupture Forecast (UCERF) Catalog (versions 2 and 3; see Data and Resources) that I included and excluded in my sample (Tables S1–S5) and provides details of nine case studies of plate boundaries outside of northern California, where a semiannual bias in seismicity is also indicated (cases S1–S9). Figures S1–S19 and Tables S6–S22 (referenced in the case studies and main article) are included, along with supplemental References.
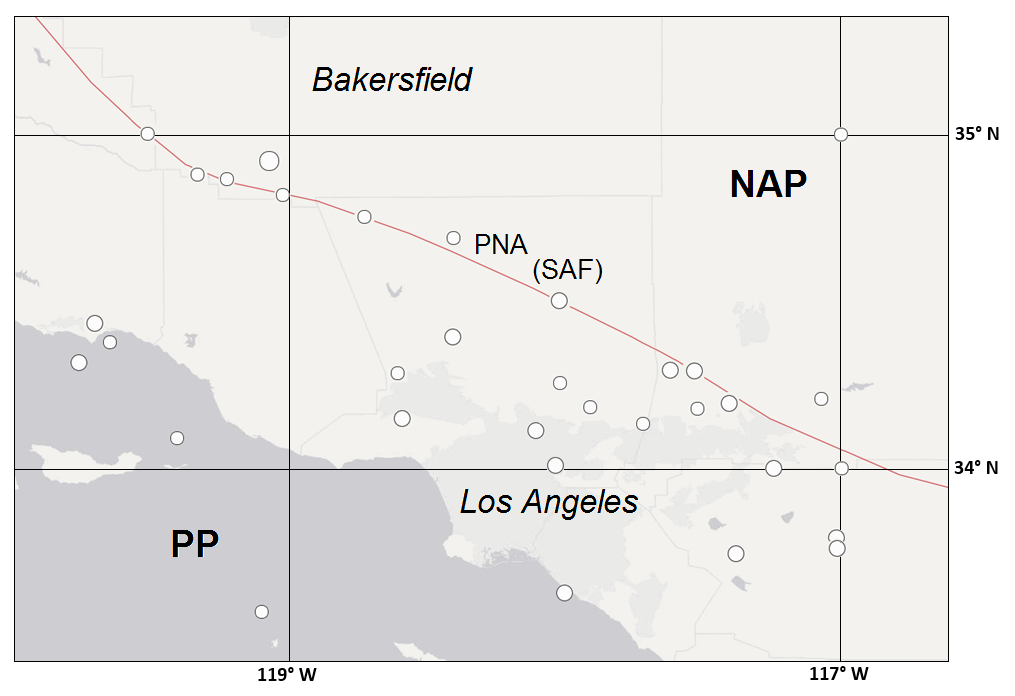
Location. Generally an east–west-oriented province spanning the Pacific–North American (PNA) plate boundary from south of Bakersfield southward into the Los Angeles basin (Fig. S1), characterized by east–west-trending ranges and associated east–west-striking thrust faults, bounded by the Pacific Ocean on the west and the Mojave Desert on the east. The Mojave segment of the San Andreas fault (SAF) ruptured through the province northeast of Los Angeles in the great Fort Tejon shock of 1857.
Data. All M ≥ 5.5 earthquakes found in the UCERF Catalog between latitudes 33.5° N and 35.2° N and longitudes 117.0° W and 120.0° W during the interval from 1 January 1850 to 1 April 2014 (n = 32; Fig. S1, Table S6), with foreshocks and aftershocks filtered per the UCERF Catalog (see discussion in the Data Selection section in the main article). The northern edge of the search box includes epicenters in the Elkhorn Hills and along the White Wolf fault south of Bakersfield, which is an area of thrust faulting similar to that in the Transverse Ranges proper but located within the Central Valley province. The M 7.9 Fort Tejon earthquake along the SAF on 9 January 1857 is included for reference, although its epicenter was likely north of the town of Cholame at 35.7° N (Sieh, 1978; Felzer and Cao, 2008). Inasmuch as the SAF ruptured through the Transverse Ranges in the 1857 shock, that event may be relevant to the clustering displayed here.
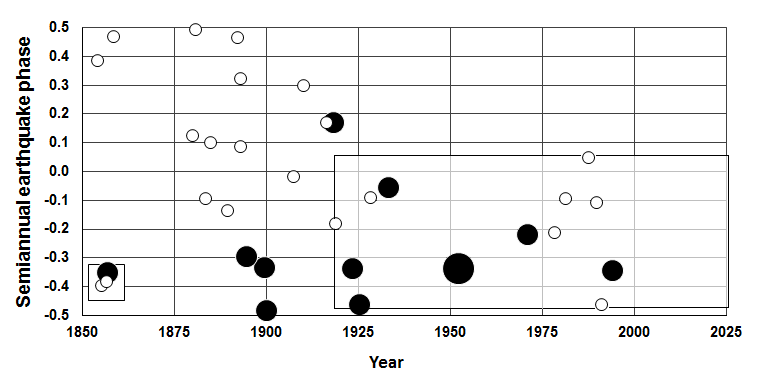
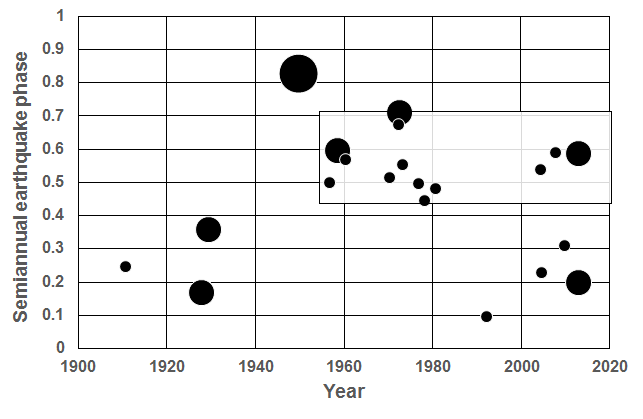
Results. The random-in-time (null) hypothesis is rejected with a binomial probability of p = 0.005 for the M ≥ 6.2 events (10 out of 11 events) from 1850 to 2011 that occurred in the postsolstice half (50%) of the semiannual cycle (Fig. S2), including 9 of 11 between phases −0.5 and −0.2 (a 30% sector) with binomial p = 0.0005. The Schuster probability for those 11 events is p = 0.015, with a net semiannual phase of −0.332 (about nine weeks before the equinox, or three weeks after the solstice). Therefore, mainshocks in the Transverse Ranges appear to have clustered primarily in the second half of the semiannual cycle (summer and winter), with a 98.5% confidence that the clustering is not random.
Seismicity at the M ≥ 5.5 level appears to have become less random in the semiannual cycle over time since the 1857 shock, particularly between 1900 and 1925 (Fig. S2). After 1918, the random-in-time hypothesis is rejected with binomial probability of p = 0.0002 for the M ≥ 5.5 events (13 out of 13) that occurred in the postsolstice half (51%) of the semiannual cycle between phases −0.461 and 0.044. The Schuster probability for those 13 events is p = 0.03, with a net phase of −0.2 (about five weeks before the equinox, or six weeks after the solstice). The postsolstice cluster after 1918 accounted for all major damaging earthquakes in the greater Los Angeles region in nearly the last century, including the 1923 San Bernardino (M 6.2), 1925 Santa Barbara (M 6.8), 1933 Long Beach (M 6.4), 1952 Bakersfield (M 7.5), 1971 San Fernando (M 6.6), 1987 Whittier Narrows (M 5.89), and 1994 Northridge (M 65) earthquakes. Therefore, M ≥ 5.5 earthquakes in the Transverse Ranges since 1918 appear to have clustered in the second half of the semiannual cycle, with a 97% confidence that the clustering is not random.
For reference, the 1857 Fort Tejon earthquake also occurred in the postsolstice half of the semiannual cycle, at phase −.389 (Fig. S2), one week earlier than the net phase of the 11 M ≥ 6.2 mainshocks that followed the great earthquake over the next 158 years. The reduction in randomness of the M ≥ 5.5 events over that time suggests that moderate- and large-magnitude seismicity in the Transverse Ranges may have returned to near the semiannual phase of the 1857 event.
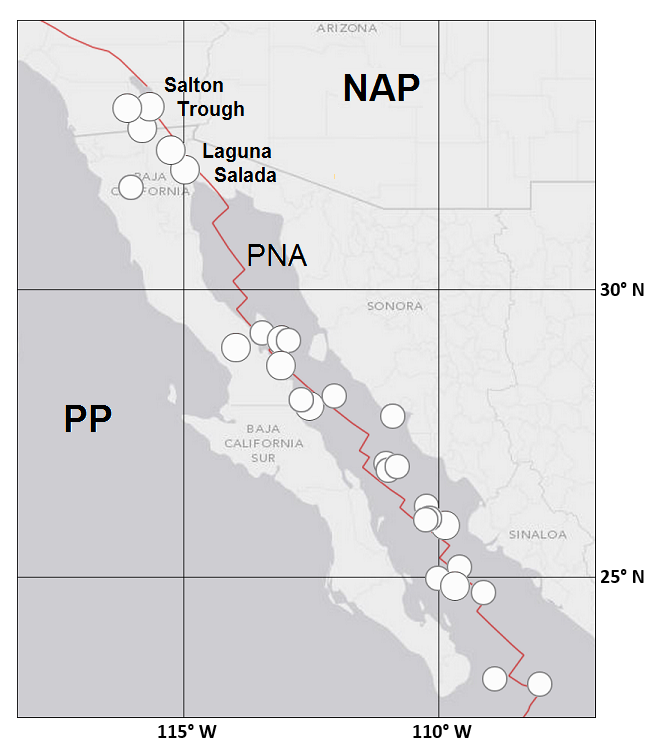
Location. Along the southern half of the PNA plate boundary, from the Salton Sea in California southward to the mouth of the Gulf of California (Fig. S3). The northern and southern ends of this fault system are, respectively, the approximate southern terminus of the SAF and the inferred transform–subduction–spreading triple-junction between the Pacific, North American, and Rivera Plates.
Data. All M ≥ 6.6 earthquakes found in the global Advanced National Seismic System (ANSS) Catalog between latitudes 23.0° N and 33.3° N and longitudes 107° W and 116.5° W during the interval from 1 January 1900 to 1 April 2014 (n = 28; Table S7), plus all 6.5 ≥ M ≥ 6.2 events from 1 January 1974 to 1 April 2014 (n = 10; Table S8) (Fig. S3), with dependent events (n = 2) filtered as noted in the discussion in the Data Selection section in the main article. I judged the catalog to be complete for M ≥ 6.6 and M ≥ 6.2 events beginning in 1900 and 1974, respectively, based on the earliest appearance of events at those magnitude thresholds in the catalog and their approximate mean rate of occurrence. I note, however, that Felzer (2008) determined the magnitude of completeness for the southernmost California and northern Baja California region of the UCERF Catalog to be M 6.9 until 1932, when it reached M 6.0. Farther south, in the Gulf of California, the detection of M ≤ 6.9 events was probably not as good for much of the twentieth century, and smaller events in the Gulf of California may be underrepresented in the sample used here.)
Large earthquakes along this plate boundary generally result from strike-slip faulting along the northwest−southeast transform segments. A focal mechanism of dextral strike slip roughly parallel to the plate boundary is indicated for the two post-1975 events for which a focal solution is available in the Global Centroid Moment Tensor (CMT) database.
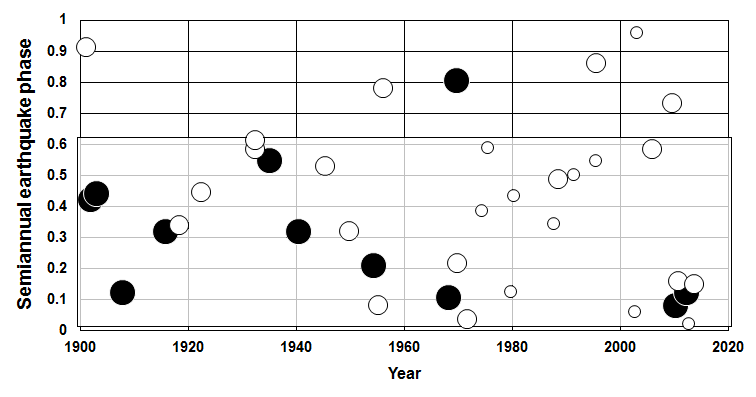
Results. The random-in-time hypothesis is rejected with binomial probabilities of p = 0.003, p = 0.005, and p = 0.0008 for the following data ranges: (a) M ≥ 7.0 events (at least 10 out of 11) from 1900 to 2014 that occurred in 47% of the semiannual cycle between phase 0.08 and 0.53 (approximately the first half of the cycle), (b) M ≥ 6.6 events (at least 23 out of 28) from 1900 to 2014 that occurred in 57% of the semiannual cycle between phase 0.04 and 0.61, and (c) M ≥ 6.2 events (at least 32 out of 38) that occurred in 59% of the semiannual cycle between phase 0.02 and 0.61. However, for all three magnitude ranges, the Schuster probability is not significant (p > 0.11) because those events were not narrowly clustered within the cycle (Fig. S4). Nevertheless, the binomial significance is replicated independently below.
Replication. On the continent, support for semiannual clustering is found in a separate data set confined to the Salton Trough (California) and Laguna Salada (Mexico) portion of this region (Fig. S3). The UCERF Catalog lists seven earthquakes of 7.0 > M > 5.5 in that limited area (Table S9) since 1957, when the catalog became complete at that magnitude level (Felzer, 2008) (UCERF search box: 32°–34° N, and 114°–116° W; aftershocks excluded per UCERF Catalog).
As did the 10 out of 11 M ≥ 7.0 earthquakes in the greater Salton Trough–Gulf of California region, all of the 7.0 > M > 5.5 events in the limited Salton Trough–Laguna Salada area likewise clustered between phase 0.05 and 0.55 of the semiannual cycle (binomial p = 0.008). Hence, the semiannual sector between phase 0.05 and 0.55 included all of the major damaging mainshocks during the 67 years after 1957, including the 1968 Borrego Mountain (M 7.0), 1979 El Centro (M 6.5), 1981 Westmoreland (M 5.7), and 1987 Superstition Hills (M 6.5) earthquakes in California, in addition to the Sierra El Mayor earthquake (M 7.2) of 4 April 2010 in northern Baja California south of the Mexico–United States border (Fig. S5).
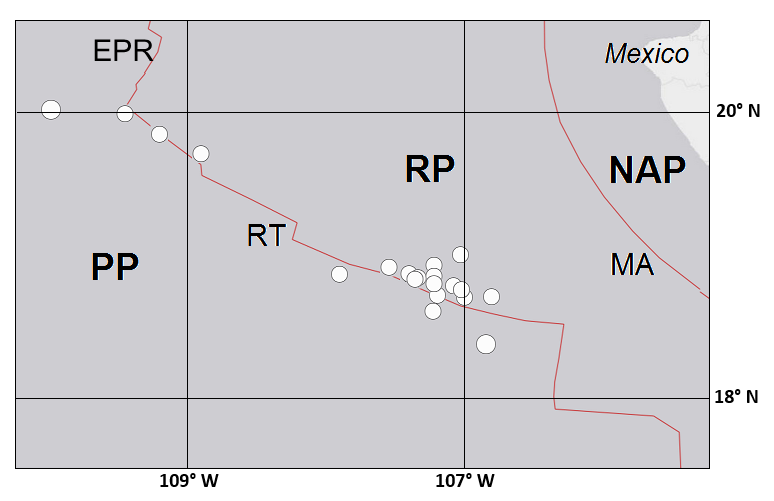
Location. At the southwestern boundary of the Rivera Plate, connecting two sections of the East Pacific Rise, extending from a point roughly 300 km west of the Colima coast in Mexico and striking northwest for about the same distance (Fig. S6).
Data. All M ≥ 6.0 earthquakes found in the global ANSS Catalog between latitudes 18.2° N and 20.1° N and longitudes 106.2° W and 111.0° W during the interval from 1 January 1900 to 1 April 2014 (n = 20; Fig. S6, Table S10), with aftershocks (n = 0) filtered as noted in the discussion in the Data Selection section in the main article.
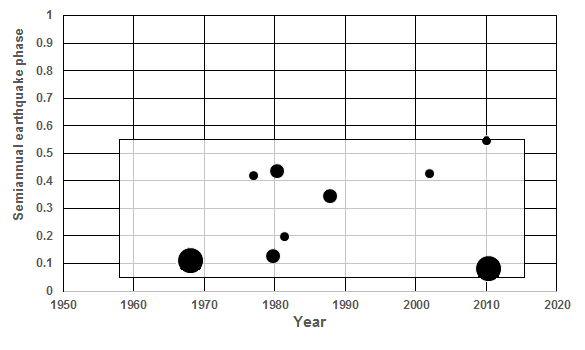
Results. The random-in-time hypothesis is rejected with binomial probability of p = 0.0006 for the events (at least 16 out of 20) that occurred in 42% of the semiannual cycle between phases 0.0 and 0.42 (Fig. S7) since 1900. For all 20 events, the Schuster probability is p = 0.015, with a net semiannual phase of 0.28 (~7.5 weeks after the equinox). Therefore, M ≥ 6.0 earthquakes along the Rivera Transform appear to have clustered in the first half of the semiannual cycle, with a 98.5% confidence that the clustering is not random.
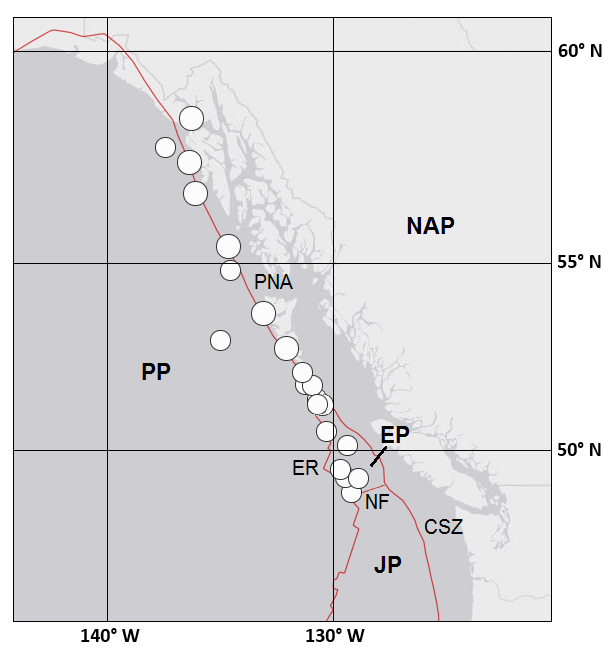
Location. At the western edge of North America along the Queen Charlotte–Fairweather transform separating the Pacific and North American Plates from near Juneau, Alaska, southeastward to near the southern tip of Moresby Island in the Haida Gwaii archipelago (Queen Charlotte Islands), and thence southward across the Queen Charlotte Triple Junction and along the Explorer Ridge and Sovanco Fracture Zone to the Nootka fault (Fig. S8). The Queen Charlotte–Fairweather transform is the analog of the San Andreas fault along the Pacific–North American transform south of the Mendocino Triple Junction.
Data. All M ≥ 6.3 earthquakes found in the global ANSS Catalog between latitudes 47.0° N and 58.5° N and longitudes 127.5° W and 138.0° W during the interval from 1 January 1900 to 1 April 2014 (n = 21; Fig. S8, Table S11), excluding aftershocks (n = 2; Table S12) filtered as noted in the discussion in the Data Selection section in the main article.
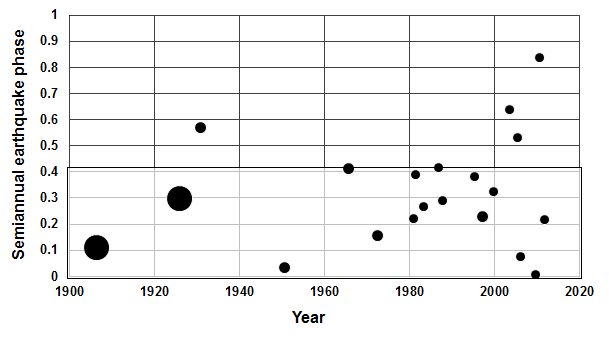
Results. The random-in-time hypothesis is rejected with binomial probability of p = 0.00003 for the events (at least 13 out of 17) that occurred in 27% of the semiannual cycle between phases 0.443 and 0.710 after the M 8 event in 1949 (Fig. S9), the largest earthquake in the record. For all 17 events since 1949, the Schuster probability is p = 0.003, with a net semiannual phase of 0.492 (i.e., two days before solstice). For all 21 events since 1900, the Schuster probability is p = 0.01, with a net semiannual phase of 0.48.
Therefore, M ≥ 6.3 mainshocks along the Queen Charlotte–Fairweather fault system and Explorer Ridge appear to have clustered near the solstice (phase 0.5) after the great earthquake in 1949, with a 99.7% confidence that the clustering is not random. Although 75% of the M ≥ 6.3 events clustered in the narrow near-solstice sector after the 1949 shock, none occurred in that same sector during the half-century before the great earthquake.
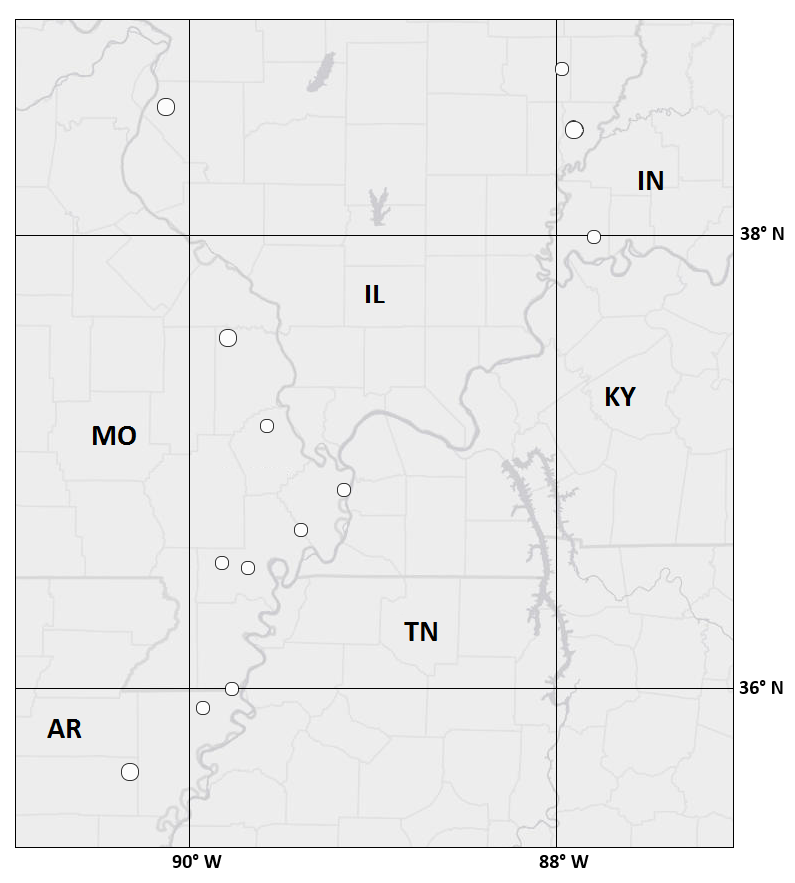
Location. Along the Mississippi Valley from eastern Arkansas to northern Illinois (Fig. S10). This midplate fault system is historically the most seismically active region in the central United States. It produced the largest historical earthquakes east of the Rocky Mountains, including three M > 7 shocks during the three-month period between December 1811 and February 1812.
Data. All M ≥ 4.3 earthquakes found in the global ANSS Catalog between latitudes 34.0° N and 41.0° N and longitudes 87.0° W and 91.0° W during the interval from 1 January 1900 to 1 April 2014 (n = 13; Fig. S10, Table S13), excluding aftershocks (n = 4, Table S14). Note that the catalog contains no events prior to 1974, when network monitoring in this region began (Liu and Zoback, 1997). As an indication of prior seismicity, I include the “Notable Earthquakes” in the New Madrid seismic zone back to 1800 (Dart and Volpi, 2010) (n = 4; Table S13), excluding aftershocks (n = 3; Table S14). Aftershocks were filtered as explained in the discussion in the Data Selection section in the main article.
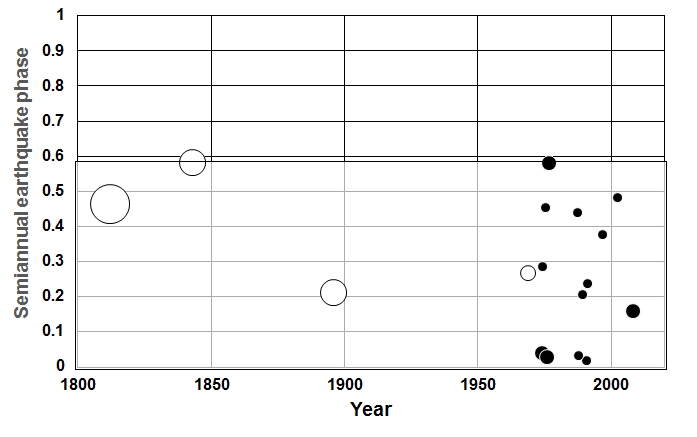
Results. No M ≥ 4.3 mainshock since 1973, and no known notable mainshock during the prior century and a half, occurred during the latter 40% of the semiannual cycle in the New Madrid seismic zone (Fig. S11). All occurred in the first 60% sector of the cycle, between phase 0.0 (equinox) and 0.581 (about two weeks after the solstice).
The random-in-time hypothesis is rejected with a binomial probability of p = 0.0002 for the events (17 out of 17) that occurred in 60% of the semiannual cycle (Fig. S11). The Schuster probability is p = 0.043, with a net semiannual phase of 0.28. Therefore, mainshocks in the New Madrid seismic zone appear to have clustered primarily in the first half of the semiannual cycle (spring and fall), with a 95.7% confidence that the clustering is not random.
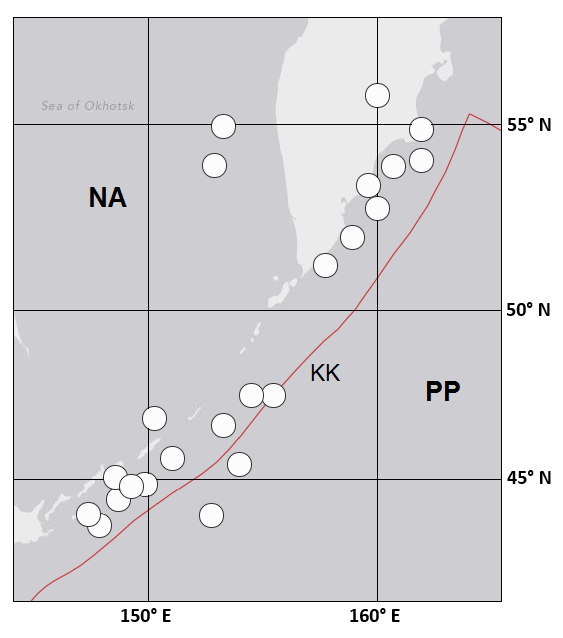
Location. In the northwestern Pacific Ocean along the Kuril Islands and Kamchatka Peninsula from Hokkaido to the Aleutian Trench, adjacent to the Pacific–North American (Okhotsk microplate) subduction zone (Fig. S12).
Data. All M ≥ 7.5 earthquakes found in the global ANSS Catalog between latitudes 43.0° N and 56.0° N and longitudes 147.0° W and 164.0° W from 1 January 1900 to 1 April 2014 (n = 23; Fig. S12, Table S15), excluding aftershocks (n = 5, Table S16) filtered as noted in the discussion in the Data Selection section in the main article.
Results. Since 1923, mainshocks in this region have occurred almost exclusively in the first 58% of the semiannual cycle between phase 0.0 and 0.58 (Fig. S13). The clustering is significant at p = 0.003 (binomial) for the events (at least 14 out of 15) that occurred within that 58% sector of the cycle. For all 15 events during that nine-decade interval, the Schuster probability is p = 0.05, with a net semiannual phase of 0.33.
Hence, M ≥ 7.5 earthquakes in the Kuril–Kamchatka region have clustered in the spring and fall, with a 95% confidence that the clustering is not random. The M 9 Kamchatka earthquake in November 1952, the largest event in the record, occurred within this cluster. Between 1923 and 1952, there was little M ≥ 7.5 seismicity in this region, and the events before 1923 appear to have been random back to 1900; hence, there was no apparent clustering before, and no clear shift in semiannual phase after, the great shock in 1952.
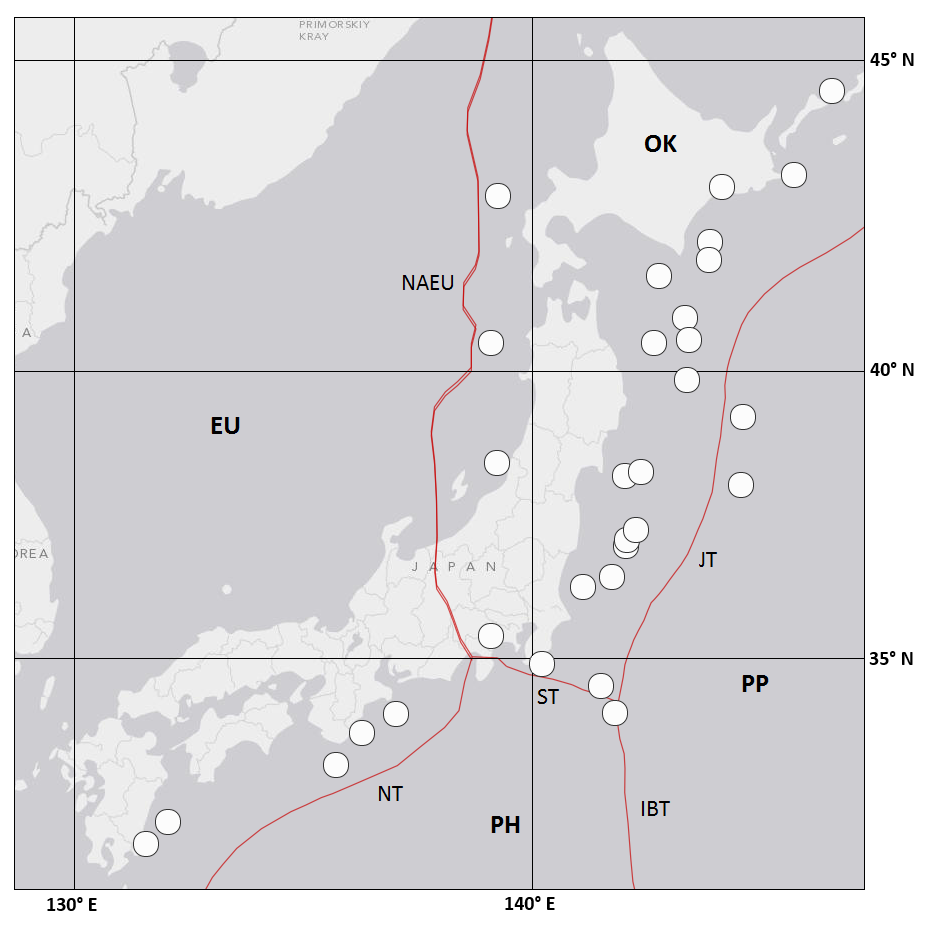
Location. Along the Japan archipelago from south of the Island of Kyushu to north of the Island of Hokkaido, including the Pacific plate (east), the Eurasian plate (west), the Philippine Sea plate (south) and North American plate (Okhotsk microplate; north), and the convergent plate boundaries between them (Fig. S14). The data are divided spatially at 36.0° N in the discussion below to illustrate the similarity in semiannual earthquake clustering between the greater Tokyo region near Sagami Bay and the region to the north where the 11 March 2011 M 9 Tohoku-Oki megathrust earthquake was centered.
Data. All M ≥ 7.6 earthquakes found in the global ANSS Catalog between latitudes 30.0° N and 46.0° N and longitudes 130.0° E and 147.0° E from 1 January 1900 to 1 April 2014 (n = 24; Fig. S14, Table S17), excluding aftershocks (n = 6, Table S18) filtered as noted in the discussion in the Data Selection section in the main article and excluding an M 7.8 midplate event far to the west near the coast of North Korea in 1973.
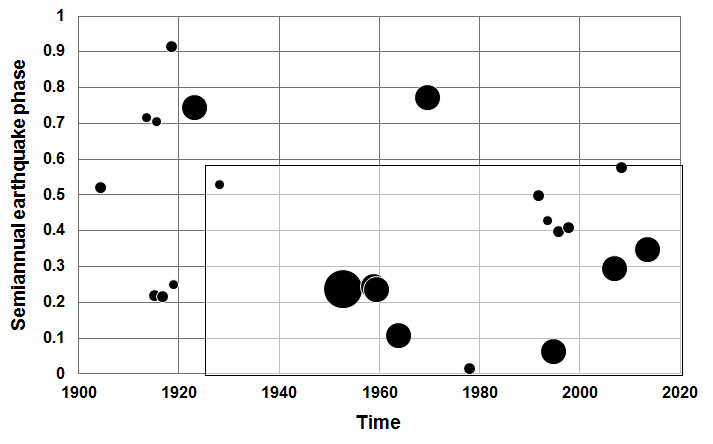
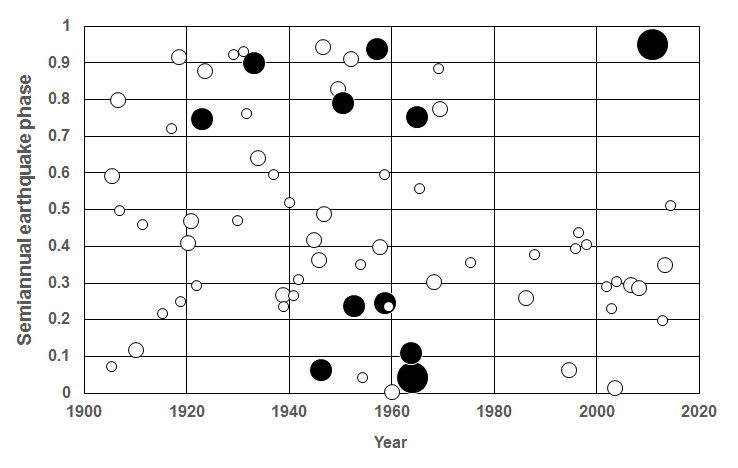
Results. Two semiannual clustering phases are apparent for the M ≥ 7.6 earthquakes between 1900 and 2014 (Fig. S15), one near the equinox and the other in the later half-cycle, near the solstice. All but one of the 16 near-solstice events occurred between the times of the two largest events in the record, the great Sanriku earthquake (M 8.4) in 1933 and the Tohoku-Oki megathrust event (M 9) in 2011. Four events between 1933 and 2011 occurred near the equinox.
During the seven decades from 1933 to 2003 (northern Honshu earthquake), the random-in-time hypothesis is rejected with a binomial probability of p = 0.0003 for the events (at least 15 out of 18) that occurred in 41% of the semiannual cycle between phases 0.236 and 0.643 (Fig. S15). For all 18 events during that seven-decade interval, the Schuster probability is p = 0.013, with a net semiannual phase of 0.42.
As indicated in Figure S15, the near-solstice and near-equinox biases in mainshock occurrence north of latitude 36.0° N (closed circles) are replicated by the semiannual timing of mainshocks along the Sagami and Nankai troughs south of 36.0° N (open circles). Four of Japan’s seven great (M > 8) earthquakes since 1900, including the Sanriku and Tohoku-Oki events, occurred near the equinox, with an average deviation of less than two weeks. The disastrous Kanto (Tokyo) earthquake in 1923 (M 7.9), with a deviation of 15 days from the equinox, was consistent with that pattern.
Therefore, M ≥ 7.6 earthquakes in the Japan region appear to have clustered near the solstice after the great Sanriku earthquake in 1933 and continued to do so until the northern Honshu earthquake in 2003, with a 98.7% confidence that the near-solstice clustering is not random. The 2003 event (two days after the equinox) may have signaled a return to clustering to near the equinox for large-magnitude earthquakes in the region. This pattern is not unlike that observed for M ≥ 6.4 mainshocks after the 1906 San Francisco earthquake, in which eight decades of near-solstice clustering was followed by the apparent return of earthquakes near the equinox in the 1980s (see Fig. 2a in the main article).
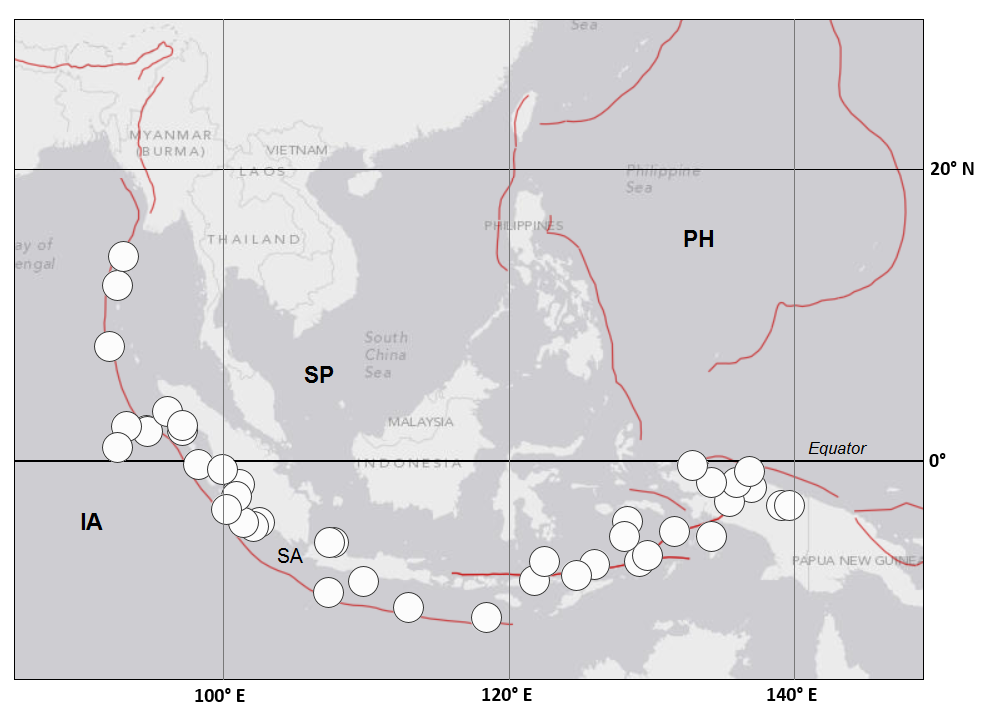
Location. In the eastern Indian Ocean and Bay of Bengal along the coast of Indo-China from southern Myanmar southward and eastward to the Island of New Guinea, generally the subduction boundary between the Sunda plate and Indo-Australian plate (Fig. S16). The northwestern portion of this zone produced the M 9.1 Sumatra–Andaman Islands megathrust earthquake on 26 December 2004, one of the largest earthquakes of the last century.
Data. All M ≥ 7.6 earthquakes found in the global ANSS Catalog in the arcuate zone centered at latitude 15.0° N and longitudes 117.0° W and between an inner circle 2300 km and an outer circle 3300 km from that center point (that arc bounded on the northwest at 21.0° N and on the southeast at 4.0° N latitudes) during the interval from 1 January 1900 to 1 April 2014 (n = 27; Fig. S16, Table S19), excluding aftershocks (n = 2; Table S20) filtered as noted in the discussion in the Data Selection section in the main article.
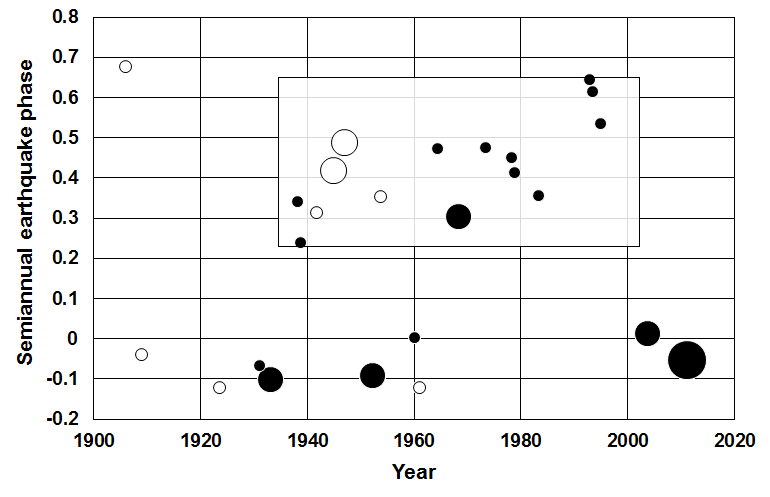
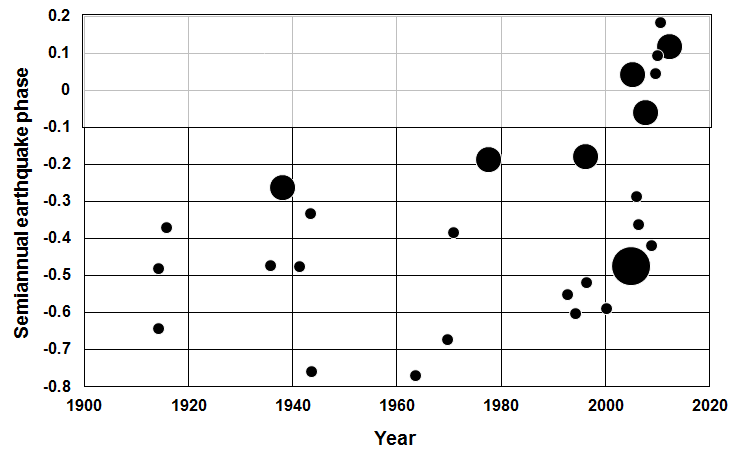
Results. From 1900 to the time of the 2004 megathrust earthquake, all M ≥ 7.6 mainshocks along the Sunda arc occurred within the same 60% sector of the semiannual cycle, between phases −0.772 to −0.177 (Fig. S17), bracketing the solstice. After the 2004 shock, most mainshocks (including three out of three M > 8 events) occurred during the remaining 40% sector of the cycle, bracketing the equinox.
For the 104 years prior to the megathrust event in 2004, the random-in-time hypothesis is rejected with a binomial probability of p = 0.0002 for the events (17 out of 17) that occurred in the 60% sector of the semiannual cycle. For those 17 events, the Schuster probability is p = 0.017, with a net semiannual phase of −0.5 (i.e., solstice). The 2004 mainshock occurred five days after the solstice.
For the postmegathrust interval, the significance of the near-equinox clustering will be revealed only by future M ≥ 7.6 mainshocks along the Sunda arc. The clustering currently is nonsignificant within the semiannual distribution of all post-2004 events (binomial p = 0.1 for at least six out of nine events within that 40% sector of the cycle), and there are too few post-2004 events as yet to test with the Schuster probability (n < 10). Nevertheless, the near-equinox clustering of large and great earthquakes in the Sunda arc since 2004, after more than a century without a known event above M 7.5 within that 40% sector (Fig. S17), is clearly extraordinary (binomial p = 10−7, for six out of six events within that 40% sector during a 9 yr interval of that 114 yr history).
Therefore, M ≥ 7.6 earthquakes along the Sunda arc appear to have clustered around the solstice until the 2004 megathrust earthquake, with a 98.3% confidence that the clustering is not random. After the 2004 earthquake, the largest events occurred near the equinox.
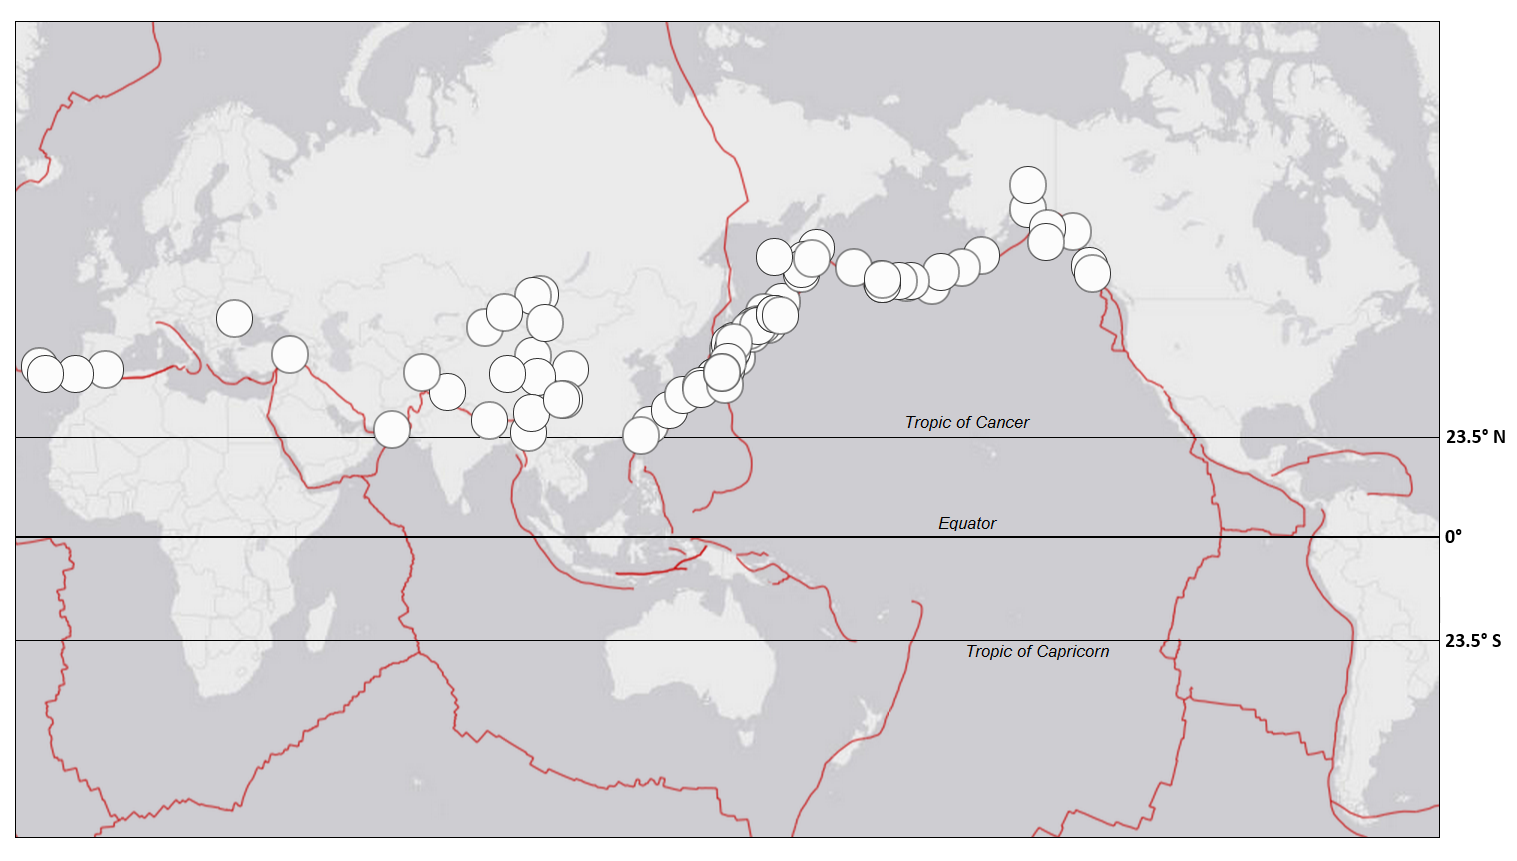
Location. Northern hemisphere poleward of the Tropic of Cancer (Fig. S18).
Data. All M ≥ 7.8 earthquakes found in the global ANSS Catalog poleward from 23.5° N during the interval from 1 January 1900 to 13 February 2015 (n = 68; Fig. S18, Table S21), excluding aftershocks and a foreshock (n = 13; Table S22) filtered as noted in the discussion in the Data Selection section in the main article.
Results. The random-in-time (null) hypothesis is rejected with a binomial probability of p = 0.0005 for the M ≥ 8.4 events (11 out of 11) from 1900 to 2015 that occurred during the 50% sector of the semiannual cycle centered on the equinox between phase ±0.25 (Fig. S19). The Schuster probability for those 11 events is p = 0.048, with a net semiannual phase of −0.029 (about five days before the equinox). Excluding the most recent event, the 11 March 2011 Tohoku-Oki megathrust earthquake (M 9), the net phase remains the same (−0.023) and is approximately coincident with the phase of the M 9 shock at −0.054 (= 0.946) (10 days before the equinox).
A significant change in the semiannual distribution of large and great earthquakes commenced about 5 yr after the northern hemisphere’s largest recorded earthquake, the M 9.3 Prince William Sound, Alaska, megathrust event on 28 March 1964 (eight days after the equinox). M ≥ 7.8 seismicity poleward of 23.5° N was random in the semiannual cycle prior to that shock and continued so until the M 8.2 Kuril Islands earthquake on 11 August 1969. Since that time M ≥ 7.8 mainshocks in the hemisphere north of 23.5° (n = 17, Table S21; excluding aftershocks, n = 6, Table S22) have remained narrowly clustered after the equinox with 16 of 17 events occurring within the same 50% sector of the semiannual cycle between phase 0.01 and 0.51 (northern spring and fall) (Fig. S19).
The random-in-time (null) hypothesis is rejected for the 45 yr interval since 1969, with a binomial probability of p = 0.0001 (at least 16 out of 17) and a Schuster p = 0.0006 (i.e., 99.94% confidence that the pattern is not random) around a net semiannual phase of 0.3. The one exception since 1969 was the 2011 Tohoku-Oki shock. Stated otherwise, during nearly the last half-century, all 17 of the M ≥ 7.8 mainshocks poleward of 23.5° N occurred within 56% of the semiannual cycle between phase −0.054 and 0.51 (binomial p = 0.00005), and that latitude band has remained aseismic above M 7.7 during the balance of the cycle (44%) between phase 0.51 and 0.95 (generally, the northern summer and winter).
Note: Modified U.S. Geological Survey Database.The original manuscript was based on data I retrieved from the U.S. Geological Survey (USGS) Search Earthquake Archives online utility, last accessed in April 2014 (see Data and Resources). Case S9 (Tables S21 and S22) was based on data from the USGS search utility last accessed on 13 February 2015. Some M ≥ 7.8 events found in the 2014 search were absent from the 2015 search, those missing events being in the Centennial Earthquake Catalog. In response to my inquiry to the USGS, the agency’s representative (personal commun., 23 January 2015) explained, “the centennial catalog is being replaced by the GEM [Global Earthquake Model] catalog and that will be available in the next week or 2.” The catalog update apparently had not occurred as of 13 February when I locked the data for the manuscript revision, because two M 7.8 mainshocks I previously found in the 2014 Centennial Catalog search (both in the Japan region after 1969) were absent from my 2015 search: on 17 June 1973 and 6 December 1978 (see case S7, Table S17). Consequently, the figures, tables, and statistics for case S9 and the corresponding main article section (Global Evidence for the Hypothesis?) do not include those two M 7.8 mainshocks, which had semiannual phases of 0.474 and 0.410, respectively. Combining those two mainshocks with the remaining post-1969 events (n = 17) in case S9, Table S21, reduces the binomial probability to p = 0.00004 (at least 18 out of 19 events within a 50% sector of the semiannual cycle between phase 0.01 and 0.51) and the Schuster probability to p = 0.0003 (99.97% confidence that the distribution is not random), and it slightly changes the net phase to 0.317 for all M ≥ 7.8 mainshocks since 1969 north of 23.5° N.
Table S1. M ≥ 6.4 mainshocks (n = 19) included in the northern-California-region sample and their phases in the semiannual cycle.
Table S2. M ≥ 6.4 mainshocks (n = 26) included in the southern-California-region sample and their phases in the semiannual cycle.
Table S3. M ≥ 6.4 events excluded from the northern-California-region sample and the reason for exclusion.
Table S4. M ≥ 6.4 events excluded from the southern-California-region sample and the reason for exclusion.
Table S5. Pre-1850 mainshocks included in the northern-California-region sample and their phases in the semiannual cycle.
Table S6. Solar semiannual (Ssa) phase of M ≥ 5.5 earthquakes in the Transverse Ranges from 1 January 1850 to 1 April 2014. The M 7.9 Fort Tejon earthquake in 1857 is included for reference in the case S1 discussion (see also Fig. S2).
Table S7. Solar semiannual (Ssa) phase of M ≥ 6.6 earthquakes in the Salton Trough and Gulf of California from 1 January 1900 to 1 April 2014.
Table S8. Solar semiannual (Ssa) phase of 6.5 ≥ M ≥ 6.2 earthquakes in the Salton Trough and Gulf of California from 1 January 1974 to 1 April 2014.
Table S9. Solar semiannual (Ssa) phase of 7.0>M> 5.5 earthquakes in the Salton Trough and Laguna Salada area from 1 January 1957 to 1 April 2014.
Table S10. Solar semiannual (Ssa) phase of M ≥ 6.0 earthquakes along the Rivera Transform from 1 January 1900 to 1 April 2014.
Table S11. Solar semiannual (Ssa) phase of M ≥ 6.3 earthquakes along the Queen Charlotte–Fairweather fault system and Explorer Ridge from 1 January 1900 to 1 April 2014.
Table S12. M ≥ 6.3 aftershocks along the Queen Charlotte–Fairweather fault system and Explorer Ridge excluded from the 1 January 1900 to 1 April 2014 data set in Table S11.
Table S13. Solar semiannual (Ssa) phase of M ≥ 4.3 earthquakes in the New Madrid seismic zone from 1 January 1900 to 1 April 2014, plus the notable mainshocks back to 1800.
Table S14. Aftershocks in the New Madrid seismic zone excluded from Table S13, including M ≥ 4.3 aftershocks (n = 4) from 1 January 1900 to 1 April 2014, in the ANSS Catalog data set, and notable aftershocks (n = 3) back to 1800 in Dart and Volpi (2010).
Table S15. Solar semiannual (Ssa) phase of M ≥ 7.5 mainshocks along the Kuril–Kamchatka subduction zone from 1 January 1900 to 1 April 2014.
Table S16. M ≥ 7.5 aftershocks along the Kuril–Kamchatka subduction zone excluded from the 1 January 1900 to 1 April 2014 data set in Table S15.
Table S17. Solar semiannual (Ssa) phase of M ≥ 7.6 earthquakes in the Japan archipelago from 1 January 1900 to 1 April 2014.
Table S18. M ≥ 7.6 aftershocks along the Japan archipelago excluded from the 1 January 1900 to 1 April 2014 data set in Table S17.
Table S19. Solar semiannual (Ssa) phase of M ≥ 7.6 mainshocks along the Sunda arc from 1 January 1900 to 1 April 2014.
Table S20. M ≥ 7.6 aftershocks along the Sunda arc excluded from the 1 January 1900 to 1 April 2014 data set in Table S19.
Table S21. Solar semiannual (Ssa) phase of M ≥ 7.8 mainshocks north of 23.5° N (Tropic of Cancer) from 1 January 1900 to 13 February 2015.
Table S22. M ≥ 7.8 foreshocks and aftershocks north of 23.5° N (Tropic of Cancer) from 1 January 1900 to 13 February 2015.
Figure S1. Locations of M ≥ 5.5 mainshocks in the Transverse Ranges from 1 January 1900 to 1 April 2014. Plates: PP, Pacific; NAP, North American; PNA, Pacific–North American (transform). The San Andreas fault (SAF) is included. (Data: UCERF.)
Figure S2. Distribution of M ≥ 5.5 mainshocks in the semiannual cycle for events in the Transverse Ranges from 1 January 1850 to 1 April 2014. Equinox is 0.0; solstice is ±0.5. Note that the semiannual phases are projected onto a shifted vertical axis to show the clustered phases without wrapping. Pre-equinox events in the lower chart area are plotted as the negative supplement of their phase angle. Solid circles: large, 7.5 ≥ M ≥ 7; small, 7 > M ≥ 6.2. Open circles: 6.2 > M ≥ 5.5. The M 7.9 Fort Tejon earthquake along the SAF on 9 January 1857 (square) is included for reference. Outlined rectangular area highlights the clustered mainshocks treated in the case study discussion. (Data: UCERF.)
Figure S3. Locations of M ≥ 6.6 mainshocks in the Salton Trough and Gulf of California from 1 January 1900 to 1 April 2014. Plates: PP, Pacific; NAP, North American. Plate boundary: PNA, Pacific–North American (transform). (Data: ANSS.)
Figure S4. Distribution of M ≥ 6.6 mainshocks in the semiannual cycle for events in the Salton Trough and Gulf of California from 1 January 1900 to 1 April 2014 and 6.5 ≥ M ≥ 6.2 events from 1 January 1974 to 1 April 2014. Equinox is 0.0 and 1.0; solstice is 0.5. Solid circles: M ≥ 7. Open circles: large, 7 > M ≥ 6.6; small, 6.6 > M ≥ 6.2. Outlined rectangular area highlights the clustered mainshocks treated in the case study discussion. (Data: ANSS.)
Figure S5. Distribution of independent 7.0 > M > 5.5 mainshocks in the semiannual cycle, between all phases 0.05 and 0.55, for events within the Salton Trough and Laguna Salada area of the UCERF Catalog, from 1 January 1900 to 1 April 2014. (Two M ≥ 7.0 events in Fig. S4 occurred in this limited area and are repeated here for continuity.) Circles: large, M ≥ 7; medium, 7> M ≥ 6; small, 6> M> 5.5. Outlined rectangular area highlights the clustered mainshocks treated in the case study discussion. (Data: UCERF.)
Figure S6. Locations of M ≥ 6.0 mainshocks along the Rivera Transform from 1 January 1900 to 1 April 2014. Plates: PP, Pacific; NAP, North American; RP, Rivera. Plate boundaries: RT, Rivera (transform); EPR, East Pacific Rise (spreading); MA, Middle America (subduction). (Data: ANSS.)
Figure S7. Distribution of M ≥ 6.0 mainshocks in the semiannual cycle for events along the Rivera Transform from 1 January 1900 to 1 April 2014. Equinox is 0.0 and 1.0; solstice is 0.5. Circles: large, M ≥ 7; small, 7 > M ≥ 6. Outlined rectangular area highlights the clustered mainshocks treated in the case study discussion. (Data: ANSS.)
Figure S8. Locations of M ≥ 6.3 mainshocks along the Queen Charlotte–Fairweather fault system and Explorer Ridge, from 1 January 1900 to 1 April 2014. Plates: PP, Pacific; NAP, North American; EP, Explorer; JP, Juan de Fuca. Plate boundaries: PNA, Pacific–North American (transform); ER, Explorer Ridge (spreading); CSZ, Cascadia subduction zone; NF, Nootka fault. (Data: ANSS.)
Figure S9. Distribution of M ≥ 6.3 mainshocks in the semiannual cycle for events along the Queen Charlotte–Fairweather fault system and Explorer Ridge from 1 January 1900 to 1 April 2014. Equinox is 0.0 and 1.0; solstice is 0.5. Circles: large, M ≥ 8; medium, 8 > M ≥ 7; small, 7 > M ≥ 6.3. Outlined rectangular area highlights the clustered mainshocks treated in the case study discussion. (Data: ANSS.)
Figure S10. Locations of M ≥ 4.3 mainshocks in the New Madrid seismic zone in the midplate region of North America from 1 January 1900 to 1 April 2014. States: AR, Arkansas; IL, Illinois; IN, Indiana; KY, Kentucky; MO, Missouri; TN, Tennessee. (Data: ANSS.)
Figure S11. Distribution of M ≥ 4.3 mainshocks in the semiannual cycle in the New Madrid seismic zone from 1 January 1974 to 1 April 2014 (solid circles), plus the notable mainshocks prior to 1974 back to 1800 (open circles). Equinox is 0.0 and 1.0; solstice is 0.5. Circles: largest open, M ≥ 7; medium open, 7 > M ≥ 6; small, 6 > M ≥ 5; smallest solid, 5 > M ≥ 4.3. Outlined rectangular area highlights the clustered mainshocks treated in the case study discussion. (Data: ANSS for post-1973 interval; Dart and Volpi (2010) for prior notable mainshocks.)
Figure S12. Locations of M ≥ 7.5 mainshocks along the Kuril–Kamchatka subduction zone from 1 January 1900 to 1 April 2014. Plates: PP, Pacific; NA, North American (Okhotsk microplate). Plate boundary: KK, Kuril–Kamchatka subduction zone. (Data: ANSS.)
Figure S13. Distribution of M ≥ 7.5 mainshocks in the semiannual cycle for events along the Kuril–Kamchatka subduction zone from 1 January 1900 to 1 April 2014. Equinox is 0.0 and 1.0; solstice is 0.5. Circles: large, M ≥ 9; medium, 9 > M ≥ 8; small, 8 > M ≥ 7.5. Outlined rectangular area highlights the clustered mainshocks treated in the case study discussion. (Data: ANSS.)
Figure S14. Locations of M ≥ 7.6 mainshocks in the Japan region from 1 January 1900 to 1 April 2014. Plates: PP, Pacific; OK, Okhotsk microplate (of the North American plate); EU, Eurasian; PH, Philippine Sea. Plate boundaries: JT, Japan trench (subduction); IBT, Izu–Bonin trench (subduction); ST, Sagami trough; NT, Nankai trough (subduction); NAEU, North American–Eurasian (convergent). (Data: ANSS.)
Figure S15. Distribution of M ≥ 7.6 mainshocks in the semiannual cycle in the Japan region from 1 January 1900 to 1 April 2014. Note that the semiannual phases are projected onto a shifted vertical axis in order to show the clustered phases without wrapping. Equinox is 0.0; solstice is 0.5. Pre-equinox events at the bottom of the chart are plotted as the negative supplement of their phase angle. Circle symbols denote events north (solid) and south (open) of latitude 36.0° N (as discussed in the text) within the size ranges of M ≥ 9 (large), 9 > M ≥ 8 (medium), and 8 > M ≥ 7.6 (small). Outlined rectangular area highlights the clustered mainshocks treated in the case study discussion. (Data: ANSS.)
Figure S16. Locations of M ≥ 7.6 mainshocks along the Sunda arc from 1 January 1900 to 1 April 2014. Plates: SP, Sunda; IA, Indio-Australian; PH, Philippine Sea. Plate boundary: SA, Sunda arc (subduction zone, transform near New Guinea). (Data: ANSS.)
Figure S17. Distribution of M ≥ 7.6 mainshocks in the semiannual cycle for events along the Sunda arc from 1 January 1900 to 1 April 2014. Note that the semiannual phases are projected onto a shifted vertical axis in order to show the clustered phases without wrapping. Equinox is 0.0; solstice is −0.5. Pre-equinox events in the lower chart area are plotted as the negative supplement of their phase angle. Circles: large, M ≥ 9; medium, 9 > M ≥ 8; small, 8 > M ≥ 7.6. Outlined rectangular area highlights the clustered mainshocks treated in the case study discussion. (Data: ANSS.)
Figure S18. Locations of M ≥ 7.8 mainshocks in the northern hemisphere north of 23.5° N (Tropic of Cancer) from 1 January 1900 to 13 February 2015. (Data: ANSS.)
Figure S19. Distribution of M ≥ 7.8 mainshocks in the semiannual cycle for events in the northern hemisphere north of 23.5° N (Tropic of Cancer) from 1 January 1900 to 13 February 2015. Equinox is 0.0 and 1.0; solstice is 0.5. Solid circles: large, M ≥ 9; small, 9 > M ≥ 8.4. Open circles: large, 8.4 > M ≥ 8.0; small, 8.0 > M ≥ 7.8. (Data: ANSS.)
For the California earthquake data, I relied on (1) the Working Group on California Earthquake Probabilities (WGCEP) Historical California Earthquake Catalog, Appendix H of The Uniform California Earthquake Rupture Forecast, Version 2 (UCERF 2) (Felzer and Cao, 2008), available at http://pubs.usgs.gov/of/2007/1437/ (last accessed December 2012), and (2) The UCERF3 Earthquake Catalog, Appendix K of The Uniform California Earthquake Rupture Forecast, Version 3 (UCERF3)—The Time-Independent Model (Felzer, 2013), available at http://pubs.usgs.gov/of/2013/1165/ (last accessed February 2014).
For earthquake data outside of the California region, I searched the global Advanced National Seismic System (ANSS) Catalog of the U.S. National Earthquake Hazard Reduction Program using the Search Earthquake Archives utility on the U.S. Geological Survey website at http://earthquake.usgs.gov/earthquakes/map/ (last accessed on April 2014). For Tables S21 and S22, this site was last accessed on 13 February 2015. All base maps in the supplemental figures were obtained from the USGS online utility on the dates I last accessed this site. I modified those base maps by adding a graticule and, in supplemental Figure S8, a plate boundary (the Nootka fault).
To characterize the faulting style of mainshocks along transform segments in the Gulf of California, I utilized the Global Centroid Moment Tensor (CMT) Catalog search website at http://www.globalcmt.org/CMTsearch.html (last accessed February 2015).
Dart, R. L, and C. M. Volpi (2010). Earthquakes in the central United States, 1699–2010, U.S. Geol. Survey General Information Product 115, available at http://pubs.usgs.gov/gip/115/pdf/textonly.pdf (last accessed 1 April 2014).
Felzer, K. R. (2008). Calculating California seismicity rates, Appendix I, in The Uniform California Earthquake Rupture Forecast, Version 2 (UCERF 2, Version 1.1), 2007 Working Group on California Earthquake Probabilities, U.S. Geol. Surv. Open-File Rept. 2007-1437 and California Geol. Surv. Special Report 203, available at http://pubs.usgs.gov/of/2007/1437/ (last accessed April 2014).
Felzer, K. R. (2013). The UCERF3 earthquake catalog, Appendix K, in Uniform California Earthquake Rupture Forecast, Version 3 (UCERF3)—The Time-Independent Model, Working Group on California Earthquake Probabilities, U.S. Geol. Surv. Open-File Rept. 2013-1165, California Geol. Surv. Special Report 228, and Southern California Earthquake Center Publication 1792, 97 pp., available at http://pubs.usgs.gov/of/2013/1165/ (last accessed April 2014).
Felzer, K. R., and T. Cao (2008). WGCEP Historical California Earthquake Catalog, Appendix H, in The Uniform California Earthquake Rupture Forecast, Version 2 (UCERF 2, Version 1.1), 2007 Working Group on California Earthquake Probabilities, U.S. Geol. Surv. Open-File Rept. 2007-1437 and California Geol. Surv. Special Report 203, available at http://pubs.usgs.gov/of/2007/1437/ (last accessed April 2014).
Liu, L., and M. Zoback (1997). Lithospheric strength and intraplate seismicity in the New Madrid seismic zone, Tectonics 16, 585–595.
Sieh, K.E. (1978). Slip along the San Andreas fault associated with the great 1857 earthquake, Bull. Seismol. Soc. Am. 68, 1421–1434.
[ Back ]