Final artwork must be submitted as electronic files. The following guidelines will help you prepare final artwork. Close adherence to these guidelines will ensure that your article will not be unnecessarily delayed during the publication process.
Color Options:
(1) Both Publication Charges and Color Charges Will Be Paid. If you choose this option, you will be able to select which of the color figures submitted should appear in color in the printed journal, and which of the color figures should appear in grayscale in print but in color online (any figure submitted in color will appear in color in the online version). Before choosing this option, please carefully review SSA’s publication charges. Each figure the author identifies to print in color will incur a fee of $250 per figure. This option requires page and color charges.
(2) Only Publication Charges Will Be Paid. All color figures submitted will appear online in color, and in grayscale in the printed journal. There are no color charges for color online only. Authors are responsible for submitting color figures that are understandable when converted to grayscale for the print version and any text references, figure legends, and captions should be written so they are appropriate for online viewing (in color) and in the print version (grayscale). For information on preparing figures, see SSA Art Guidelines. If you choose this option of color online and grayscale in print, it is essential that you review the Tutorial on Producing Online-Only Color Figures from the SSA Art Guidelines.
Authors may not change their color option after acceptance.
- Applications
- Resolution
- Labels
- Text within Figures
- Line Weights
- Color
- Color to Grayscale
- Patterned Fills
- Maps
- Foldouts
- Cropping
- Saving Files
- Tutorial on Producing Online-Only Color Figures
Applications
Adobe Illustrator and Adobe PhotoShop are preferred programs in which to create artwork, and it is preferred that the images be saved as .eps files. Artwork created in Freehand, Canvas, CorelDraw, or other programs is acceptable only if it is saved in the correct format (see Saving Files) and at the proper resolution (see Resolution).
Graphics created in WordPerfect, Microsoft Word, PowerPoint, or Excel are low-resolution images; they look good on a computer screen, but they are not suitable for professional reproduction. Therefore, Microsoft Word, PowerPoint, and Excel are not acceptable applications.
Resolution
The resolution that you use when you create a file determines the usability of the file and the quality of the printed figure. We cannot improve the quality of a file created or scanned at low resolution. Typing a higher resolution value into the application after graphics have been created and saved will not improve quality, and the files will be unusable.
TIFF or JPEG files must be created or scanned at between 600 and 900 dpi for line art (black and white only), between 266 and 300 dpi for color and gray-scale images, and between 500 and 900 dpi for combination line-art and gray-scale or color images. Graphics submitted with resolutions less than these are not acceptable.
Screen captures (images taken from a computer screen or Web site that are 72-96 dpi) are not acceptable. These types of images are suitable for screen display but are far below the acceptable standards for print reproduction.
Number figures in ascending numerical order throughout in the text. Within each figure, do not include a title or any text that is included in the figure caption. Submit captions as a separate, consecutively numbered list embedded in the text of the manuscript. Do not include captions within the high resolution figures themselves. However, for the review process, you may submit a version of your figures in Word or PDF format with the caption below each figure. You may wait to submit your high resolution figure files if your paper is accepted for publication.
Each figure panel should be consistent in size and contain a label in the upper left corner. The panel labels should be labeled in alphabetical order [example: (a), (b), (c), (d)], appear in 12–point Helvetica lowercase type, and labeled clockwise (left-to-right).
Alt-Text
Authors should include “alt-text” for figures, which is short text about an image, figure, or graphic that is read by screen readers or other assistive tech and provides information to the reader. In order to make sure that alt-text is part of the peer review process and exported correctly to the compositor, authors should provide this text for figures, images, or graphics during submission.
Authors should provide the alt-text on a separate line after the figure caption, so that the alt text can be associated with the respective figure. Alt-text should be no longer than 700 characters.
For more information on “alt-text,” please see the SSA Alt-Text Guidelines.
Text within Figures
Use a standard, readable typeface such as Helvetica or Times Roman and, if possible, use a type size between 10 and 12 points.
Avoid inconsistencies in type font and size within a figure and from one figure to the next. Use the same size type for elements of equal importance. Some variation in size for emphasis may be necessary, but use no more than a 2-point variation.
Units of measurement and abbreviations should be consistent from one figure to the next and between figures and text.
Avoid using light or white text on a dark background.
Avoid small open symbols; they tend to fill in if the figure is reduced. Ensure that superscripts and subscripts are legible.
Proofread all text within a figure to ensure that it is accurate and that spellings and abbreviations are correct.
When submitting EPS files, make sure to have the application program embed all fonts used in the art.
Line Weights
Figures created for reproduction at 100% should have line weights of 0.5 to 1.0 point. Lines thinner than 0.5 point will disappear if a figure is reduced; lines thicker than 1 point will be too heavy in figures that are enlarged. Lines thinner than 0.5 point may not print even if the figure size is not changed. The most successful line art is done with solid black lines on a white background. Key lines or boxes around figures are not necessary and are discouraged.
Color
The colors in published figures may not exactly match the colors in the originals. Regardless of media, format, or application, color files will definitely not match what you see on a computer monitor, which displays RGB color. For printing, RGB files must be converted to CMYK, a process that could change the hue or brightness of some colors.
Whenever possible, submit color figures as CMYK instead of RGB.
Color to Grayscale
If you want your color digital file to be printed as gray scale, it is your responsibility to supply a single version of the figure that will be clear when used in color online and in gray scale in print. Authors cannot submit two versions of the same figure, one for color and one for black and white; only one version can be submitted. Be aware that elements such as lines in graphs will not be as clearly differentiated in gray scale as they are in color. Also, colors close to the same value on the original (for example, 50% orange and 50% red) may appear to be the same shade of gray when converted. This is also true of colors that are distinct (for example red and blue will both become dark gray). To avoid this, provide art that contains patterns and dotted or dashed lines to depict different elements. Avoid light-colored (such as yellow) text. If you use a color shading scheme, such as blue to red, that does not transfer to gray scale well, then you must add contours to your figure so that the reader of the print edition can tell which values are high and which are low.
Figure captions and in-text references to figures must not refer to the color of a line, symbol, or other element. The text and the caption must be appropriate for both online and print versions of your paper. Including a key in your figure allows you to identify each element in a manner that is equally correct in color and gray scale.
For more information see our Tutorial on Producing Online-Only Color Figures that can be printed in gray scale.
Patterned Fills
We prefer that you use black-and-white fill patterns instead of shades of gray. Graphics that use fill patterns are sharper and easier to understand. To fill a bar in a bar graph, for example, use a series of diagonal lines rather than a screen.
Suggested fill patterns:
![]()
![]()
![]()
![]()
![]()
![]()
If you use shades of gray, use no more than three shades of gray in increments of at least 20%. Check to ensure that the elements are easily distinguished from each other.
Many patterns are specific to applications they are created in (such as Canvas, CorelDraw and Freehand) and therefore may default or drop out when the figure is printed or saved from one format to another. It is very important that files that include patterns be proofed carefully on hard copy before submission.
Do not use fonts for patterns or elements such as symbols in graphs; make sure these are drawn as art elements instead. Fonts used in this manner often default or drop out during conversion for publication.
Maps
Maps must include geographic coordinates and/or scale.
Foldouts
Foldouts are costly but can be accommodated with permission from the Editor.
Cropping
The files should be cropped to remove nonprinting borders. Any elements not intended for print should be removed.
Saving Files
Save each figure as a separate file. Each file should contain all parts of the figure.
Include the figure number in the file name of each figure; e.g., fig 1.eps, fig 2a-d.eps.
We prefer that you submit EPS vector files (raster formats such as TIFF and JPEG are acceptable but are prone to distortion when scaling).
When saving EPS files, make sure to embed all the fonts. When saving Adobe Illustrator files, or before including them in a PDF file, please delete all hidden layers to make sure they cannot become visible when processed by the online submission system or the compositor.
Tutorial on Producing Online-Only Color Figures
Introduction
BSSA’s policy of allowing color figures online and gray scale in print gives authors the chance to utilize color in their papers even if they do not have sufficient funding for the color printing charges. Along with this opportunity comes the responsibility to produce figures and text that work well in both the online and the printed editions of BSSA. It is the author’s responsibility to write text that does not refer to the colors in the figures and to produce a single version of the figure that will be clear when used in color online and in gray scale in print. Authors cannot submit two versions of the same figure, one for color and one for black and white; only one version can be submitted. Nor can the text be modified between the two editions. Failure to produce acceptable figures and text will likely delay the publication of your paper.
It is not possible for the gray-scale version to be as good as the color version, but it is possible to produce figures that are very good in gray scale. This tutorial demonstrates ways to produce acceptable figures.
Checking your figures
Before submitting your original or revised paper, check your figures to make sure they are legible in both color and gray scale. This can be done in a number of ways:
- use a program such as Photoshop to convert a copy of the figure to gray scale,
- print the figure in gray scale using a black-and-white printer or changing the settings on a color printer,
- examine the figure in gray scale on your computer monitor. In Mac OS X this can be done under System Setting, Universal Access, Use grayscale. Windows users who don’t already have a graphics or photo-editing program that can display color images in grey scale can download the free program GIMP from www.gimp.org. After installing GIMP, take the following steps:
- Open the file that contains the color image.
- Launch GIMP and use the menu to select “file” then “new.”
- A “create a new image” menu window will open. You can reset the size of the new file from the default values of 420 x 300 pixels to other values. A size of 600 x 600 pixels usually works well.
- Select “OK”. A window will open showing the canvas for the new file. From the menu at the top, select “image” then “mode” then “grayscale”.
- At this point you can move back to the file that contains the color image, copy it, and paste it into the GIMP window. You should get a gray-scale image that you can compare side-by-side with the color image.
- Use “edit” then “undo” to delete the image from the GIMP window, and use copy/paste to view the next color image.
Lines and symbols in figures
When preparing a figure with lines and symbols, you can produce a graphic that will work in both color and gray scale by properly utilizing line types, line widths, different symbols, and keys. For instance, this figure works well in color,
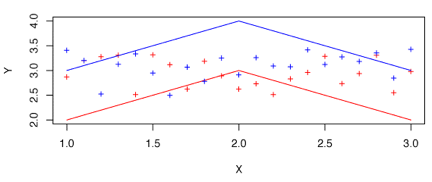
but cannot be understood in gray scale,
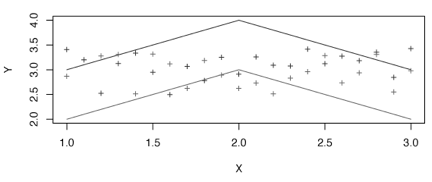
because, without a key, it is difficult to discuss the different lines and symbols without referring to their colors.
This figure can be improved by changing the line widths, using dashed lines, changing symbol types, and adding a key in addition to using different colors, as shown here:
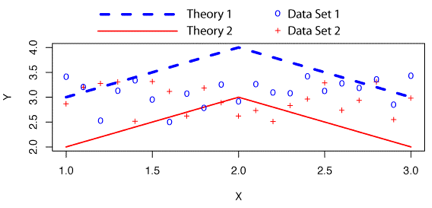
The figure can also be understood in gray scale:
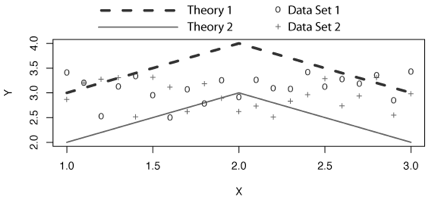
And the key makes it easy to refer to the two theories and data sets in the text without mentioning the colors used to plot them.
Shaded figures
When representing a velocity model, shaking distribution, or other field in a color figure, it is often useful to use shaded colors to represent the values. Seismologists often use a color scale that goes from red for low values through white and into blue for high values. Unfortunately, this color scale does not work well when printed in gray scale, because both blues and reds go to similar shades of gray. For instance, the following figure is clear in color
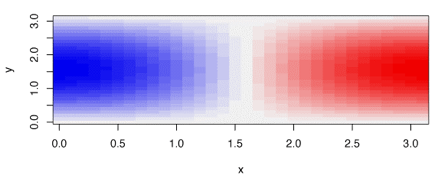
but does not work well in gray scale
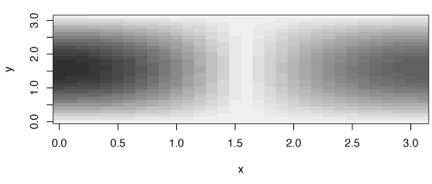
because it is impossible to tell which end has the high or low values, and intermediate values would be very hard to differentiate in a more complicated field. This could be fixed by using a different color scale. For instance, a scale known as a “heat” scale works well in color
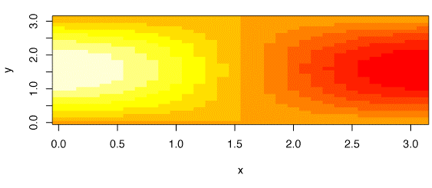
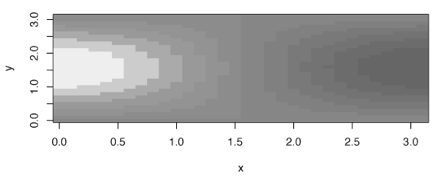
and adequately in gray scale:
However, many authors may wish to use the more traditional blue-to-white-to-red color scale. In that case, the figure can be improved by adding labeled contours so that the reader can tell where the high and low values are both in color,
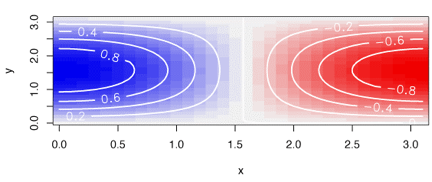
and in gray scale.
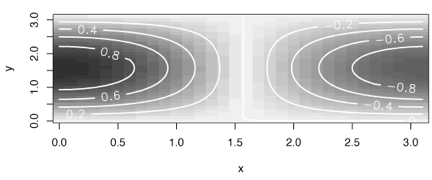
Using white contours and labels makes the contours easy to read in the dark regions that are most confusing in the gray-scale image.
When overlaying other symbols or lines on a shaded image, make sure that the symbols and lines are legible in both the color and the gray-scale images.