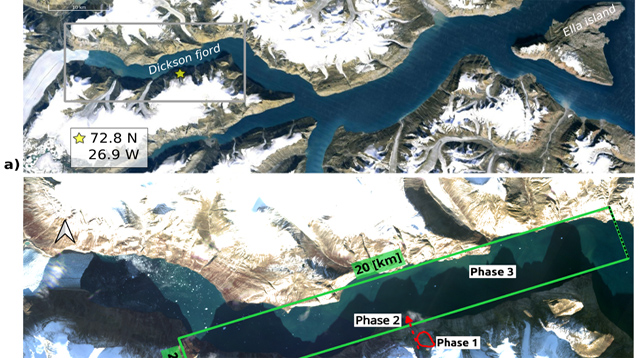
Aerial overview of the study region, with the landslide location (yellow star) on the southern shore of the Dickson fjord. The green box is a simplified model of the seiching effect. Phase 1 corresponds to the landslide, Phase 2 marks the entrance of the landslide into the fjord, and Phase 3 is the megatsunami with water waves initiating a seiching process. | TSR (2024) Carrillo-Ponce et al.