16 April 2026—Researchers used the large language model Gemini 2.5 Pro™ to extract data from personal reports of a 1957 earthquake to create a shaking intensity map for the magnitude 5.3 event that rocked the San Francisco Bay Area.
The process that turned Gemini into a “digital archivist, described at the 2026 SSA Annual Meeting, was developed by a California high school student. He and his colleagues say the workflow could be used to extract macroseismic data from other written historical sources.
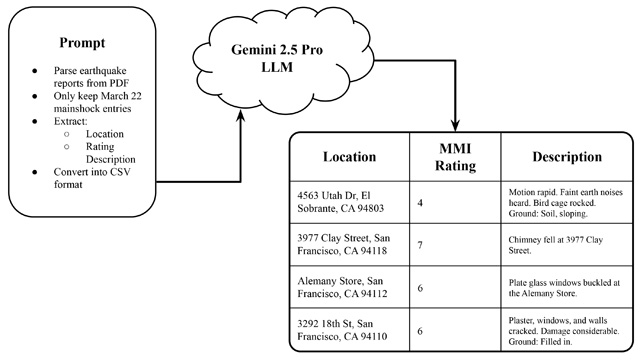
Aarnav Agrawal, now a high school senior at Monta Vista High School in Cupertino, California, and his colleagues fed a dense collection of reports about the 1957 Daly City, California earthquake to Gemini, along with a fine-tuned set of instructions to extract addresses, event descriptions and earthquake intensity values assigned at the time of the earthquake.
The research team then used Google Geocoding API to assign exact geographic coordinates for account, many of which included street addresses.
These data helped Agrawal and colleagues build a shaking intensity map that they say comes close to modern-day “Did You Feel It?” maps created by the U.S. Geological Survey for modern earthquakes. The intensity values on the map closely match with values calculated from instrumental data for the magnitude 5.3 earthquake, they note.
Historical seismologists use macroseismic data—or the documented effects of earthquakes on people and structures—to learn more about earthquakes for which there are sparse or no instrument data.
In the case of the Daly City earthquake, documentation comes in the form of hundreds of postcard questionnaires collected by the U.S. Coast and Geodetic Survey (USCGS) from people who described what they felt and what was damaged around them during the earthquake. The USCGS used these reports to estimate earthquake shaking intensities.
The postcards themselves are difficult to access, but the USCGS published summaries of many postcard datasets in large Abstracts Reports.
“The reports are available online, but only in poor-quality, low-resolution PDFs,” explained study co-author Susan Hough, a seismologist at the U.S. Geological Survey. “I looked at a 1954 earthquake, and I literally sat at home and typed out hundreds of accounts. Then I went to the web and located hundreds of addresses. It was excruciating.”
Hough then learned about a study by Harvard seismologist S. Mostafa Mousavi that used an LLM to extract data from social media posts about earthquakes to create ground shaking intensity measures. She and her colleagues decided to test the AI’s capabilities on the Abstract Reports.
That’s where Agrawal came in. “Last summer I was looking for research opportunities, and Professor Mousavi allowed me to work on research with him, and he put me in contact with Dr. Hough,” he said.
Agrawal developed the workflow for the digital archivist study, discovering how much of the original PDFs he could feed into the model at a time (20-page chunks), refining the prompts to extract the data the researchers needed for the shake map, and including the geocoding API into the process.
The Abstracts Reports data for Daly City were processed in about a half hour. The result was more than 2,300 geocoded intensity reports.
Agrawal had prior experience with large language models and machine learning generally, “and I’m very interested in the intersections of AI and machine learning with Earth and environmental science.”
The researchers will report the full results of their study in an upcoming issue of Seismological Research Letters.